report

EURUSD trading signals. Offer limited

so, friends. For the reason that, that I declared my intention to start learning trading through the prism of my experience and knowledge, including candlestick analysis, psychological problems in trading, hindering the achievement of the goal, лично испытанные торговые тактики и стратегии на различных инструментах и ТФ, and the same experience in overclocking a depot, то передо мной встала довольно креативная и […]

analysis of statistics part 3


I continue a series of fascinating studies of my trades.
now then, what I did in part 2 I projected onto the time parameter!
here by analogy:
make selections separately for positive trades and separately for negative ones and divide into several time groups (American time):
1. 9:30-10
2. 10-11
3. 11-12
4. 12-13
5. 13-14
6. 14-15
7. 15-60
calculate the profit factor for each.

well… and then an interesting surprise awaited me :) – turns out, I shouldn't open the terminal before 12.. and, a week earlier I suggested offhand, that you shouldn't enter the market before 11. ha! no matter how. stata speaks! Yes… with 11 to 12 I took some coins from the market, but somehow I didn't count the losses, although I knew, that there are a lot of them too.. the most interesting time for me – обед! get hurt…

there are a couple of hazy intervals – it with 9:30 to 10 and s 15 to 16 (last hour before closing). Over there – few deals, therefore the sample is not representative (I fucked up the whole course in mathematical statistics at the academy, ну что ж – I had to retrain and master the terms:))..

I think, that it makes sense to test these intervals with an incomplete lot.

By the way, I have a quiz question for you – What do you think: what is the easiest entry into a trade??

Mario Gabelli / Mario Gabelli

Mario Joseph Gabelli (Mario Joseph Gabelli) was born 19 June 1942 of the year. He spent his childhood and youth in the Bronx, where he attended primary school first, and then the private Jesuit school for boys at Fordham University. In his spare time Mario, hitchhiking, traveled to the northern suburbs of New York, to Westchester County, where he worked as a caddy (a carrier of golf clubs and other equipment) in leading golf clubs, such as Winged Foot and Sunningdale. There he met many people, have achieved success in life, and these people often talked about investing in stocks. Later Gabelli told, that already in those days I read market reports for my own pleasure, and bought my first shares, when he was all 13 years. Upon graduation, Gabelli received a scholarship and went to college at Fordham University. There he stood out not only with his hair, which at that time was still red, but also desperate enterprise. He always had another get-rich-quick scheme ready., like selling electric flashlights from the trunk of your own car during the period, when the streets and shop windows were poorly lit.

analysis of statistics part 2

i always knew, what to know what price range of stacks a trader trades well, какой хуже, and how awful – it DOES WEIGHT!
pity, that in Silantyev's journal this function has not yet been taken into account, I had to work with pens for half an hour, but this, чёрт возьми, worth it..

so, know a little about working with tables, сортировкой, fetching data in excel – need to. it turned out, it's not that hard, that's why – do not be alarmed..

what we do:

1. take all negative trades and take the entry price for each negative trade
2. the same for the plus
3. put in two separate tables
4. we start sorting by price ranges for minus: $1-10, $10-20, $20-30, $40-100
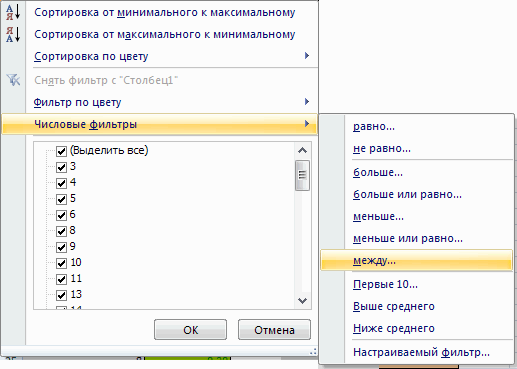
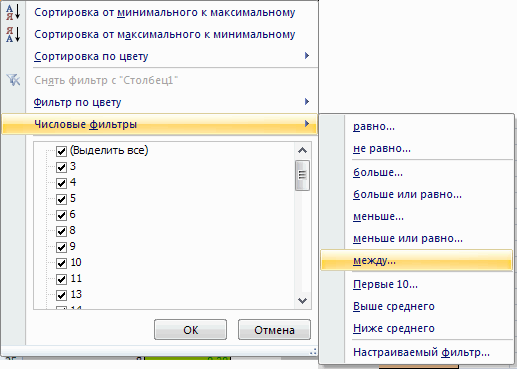
it turned out like this for me, because deals with stocks are more expensive $40 turned out to be the least, so I covered them in one group. for that, so that the table produces a selection for the desired range, we need to get into such a menu:

and drive in the desired range one by one.
then select the selection and put it into a new mini-table, accordingly, I succeeded 4 mini tables: all moose in the range 1-10, Then 10-20 etc..
It's cool! now we sum up all the losses for each sample.. опа! you can immediately see which segment is worse. but that's not enough.
5. we do the same for positive trades and also divide them into mini tables with samples of profits, sum them up for each range.
6. here it is! we calculate the profit factor for each range and specifically enlightened:)
Let me remind you how PF is calculated = sum_all_profits / sum_all_loss.
good if the profit factor is greater 1.2, poorly, if less 1 and it's terrible if in the area 0.5
my case – absolutely terrible profit factor (0.6-0.7) for transactions in the segment 30-40 and higher 40..

WOOOW! I immediately thought.. means my trading can become more efficient, if i stop reserving more expensive shares $30.
the circle narrows – concentration rises!

trailing stop. For and against

This topic, in principle, is rarely discussed., meanwhile, I consider the habit of trashing profits to be one of the components of success. The trawl does not have to be mechanical. Profit can be trashed mentally. You can trust your intuition, you can transfer periodically protective stops. I used to trade like this: opened a position, проанализировав график, noting support / resistance levels, by drawing channels, pulling the Fibo mesh, мог […]

Few conclusions

The most important thing in improving your trading is the constant analysis of your mistakes., crossing out what prevents you from earning and leaving what makes a profit. Cut down on losses and let profits flow. Everything ingenious is simple, but the realization of this for everyone happens in different ways and not everyone can reach this. 90% days on which I start trading in the first hour end with a minus, even if the day started with a good profit. Therefore, I should not trade before 10:30, the most profitable trades were opened about 10:40-11:00 and continued from 30 minutes to time. The most profitable days of the week are Tuesday, environment, Thursday On Wednesday a lot of news and open trades before 11 hours are not recommended A new aggressive method yields positive results, But don't overdo it. The fourth and fifth addition to a position leads to a deterioration in price and a large position. It turns out a bad stop on a large position. There should be no more than one week, two days are negative and the minus for them should be in 2 times less than the average plus day.

Rezvyakov vs Gerchik

Published by & quot; on the portal invest-liga.ru in the blog Maxim_Pr". You can comment here or Over there.

I wrote about Gerchik's seminar not so long ago in LJ, and here Martynov posted an interview with Alexander Rezvyakov on his blog, which I listened to with interest. And got interested. Heard about him many times before, but before that I saw only a small calculation on the channel `` About money ''. Quite commonplace things were said there., like letting profit flow, резать убытки, trade trends and comfortable amounts. However, presenters and invited experts spoke more, than Alexander. I got to look for available materials on the Internet, but to be honest, found very little in the public domain.

Several 10-minute lecture scraps, practically repeating one another, and a small fragment of the seminar on the Ukrainian website.  Opinion, however it happened, и очень хорошее.

Now to the topic title. What are the fundamental differences, in my opinion, with his overseas colleague.

Gerchik calls to plow, shoveling thousands of stock charts, all thoughts and conversations of a trader should be occupied by the market (more or less like this). Rezvyakov convinces to focus on a single tool – фьючерсе на индекс РТС. Is talking, what can trade 1-2 days a month, devoting life to other things. Gerchik, насколько я понял, more busy looking for turning points, because. the system is built at the entrance to the rebound from strong levels with short stops. Rezvyakov trades trends – the chance of their continuation is much greater, and profit is more significant, than entering a counter-trend. Gerchik calls for trading on the western markets, there is more liquidity, Rezvyakov objects, that it is easier to trade Russia, and there is enough liquidity here too. Positions himself as a pure tech analyst. Doesn't advise listening to experts, следить за новостями, watch other instruments, because. this is against the classic TA. Throws a small pebble in the fundamentalist garden" – for example, price is traded here – And he, according to some of his methods calculated, that it should cost so much, и значит, someday she will be there (draws an ascending line upward), but very often, the price turns out as a result here (draws a line down). The stock costs exactly that much, how much are willing to pay for it at the moment. No one can know, where will the market go, while fundamental analysis works on very large intervals. If the price went like this (draws a strong candlestick down and a small correction) there is every reason to believe, what will she go on. On which movement we will take more profit, here, or here…? Seemingly clear and obvious things, but he serves them correctly, доступно. I would call his approach efficient and energy-efficient.. Gerchik has a somewhat extensive method.. And the seminars themselves, despite all the charisma, more blah blah blah, посмеяться, anecdotes to poison, stories from life, and the practical benefit is less by an order of magnitude.

Answers to Palych's questions

Yuri, when you had a press conference, You said you can ask questions right here.

Yes, certainly.

“I will have a question about testing. Describe, if not difficult, testing and optimization process in a few sentences. In the literature, it is recommended to divide the entire testing period into several intervals and test the system separately at each of them..

An idea comes to mind, the program encodes inputs, exits, test starts, analyzes the results. The literature recommends correctly. For example, parameters for the system are selected on the interval 2000-2007 of the year, and then if the results are good, the site is tested on the interval 2007-2010 of the year. If negative results are obtained in this interval, then the parameters were just adjusted and the system does not inspire confidence. If on this interval the results are just as good, that is, the hope that the system will work in the future. The testing interval should include various market conditions — bearish, bull markets, saw, high, low volatility. Then you need to check transactions manually, at least deals 50. Often, after such a check, it turns out that the system looks quite cunningly into the future due to the peculiarities of a particular testing program..

See also. How do you test the inputs, feet, exits. All separately and then only combine into the system. Or else first “come up with” system and then test it entirely.

Бывает по разному, depending on the idea. For example, if we catch an instant price change, then the exit should be immediately when the movement is exhausted, since the idea of ​​the system — моментум. If the idea — catch big movements completely, then trailing exits.
BUT–a-a understood, You probably mean to test the outputs for random inputs and inputs for random outputs.? Not, I very rarely do this and only for the purpose of specialized research. And in general, I immediately test the system completely, where the inputs and outputs correspond to the idea of ​​the system.

How do you evaluate the test results and how do you compare the systems with each other based on the results of such testing.

First of all, I look at the equity of the tested system and you can see everything from it.. It should be smooth, without large drawdowns. From the coefficients, I watch everything that is possible, but if you arrange them in order of importance, then it will be like this:

Recovery factor
Коэффициент Шарпа (for portfolios)
Average profit per trade
Profit factor

I don't like it when the ratio of winning / losing trades is less 40%. AND, respectively, when the size of the average losing trade significantly exceeds the value of the average winning trade.

There is such a book – R. Colby “Encyclopedia of technical market indicators”. Paid attention to her? There the author briefly describes the testing procedure., and then gives the results of testing various systems and indicators in the MetaStock program.

Yes, but long ago, so I don't really remember. If I'm not mistaken, it just tests different indicators one by one? I also tested all available indicators in due time.. But it's better to combine them — alone as filters, others as a trigger. But every day the markets are becoming more efficient and traditional indicator systems are becoming, vice versa, неэффективными :)

He also describes the testing procedure and indicators in his book. “Computer analysis of futures markets” C. Lebeau.

Yes, remember, I listened to this book on headphones while jogging in the park about four years ago. I liked her — the author writes truthfully, does not promise mountains of gold.

Already studied everything that is possible. And from which side to approach testing, I did not fully understand.

Well i guess, if from the very beginning, then you just need to take ready-made public systems and study them a little at different markets, and there your ideas will appear.

Price Action – analysis of peaks and troughs

I have already written an article about ways to determine the trend.. But today I want to talk about the price action method. – analysis of peaks and troughs, it also worked the old fashioned way and now it works fine. Of course there are many “машинных” methods of determining the trend and the use of indicators, but they are all lagging. The best indicator – this is the price itself.
By looking at any chart, […]

analysis of statistics

wow! he drives… that's what surfaced in February:

1. if I stopped trading after the first two negative trades – the total losses would be smaller..

2. if I minus the first deal, and the second one plus – at least the day's total was above zero..

3. days, when the first trade was positive and I took above average in each of them ended with a good plus, moreover, most of the first trades these days were made strictly after 11:00AND (ie. first hour and a half of bamboo smoking session)

4. days, when the first two trades were negative, as a rule, they became jellied and I did these two trades before 11:00AND

conclusions for the coming week are:
— the first hour and a half of trading, you don't even need to open the terminal
— with 11:00 to 11:00ET or 19:00-19:30 Moscow time it is already possible to aim at some stacks
— if there are two minuses in a row by the first trades, then & quot; go away fuck, market & quot;:))
— if the first positive trade, and the next two minus, then similarly.

in general, everything seems to be simple :), it is difficult, however, to force yourself to leave at the very beginning, when I spent a lot of time preparing for trading..

Scroll to Top