i always knew, what to know what price range of stacks trader trades well, какой хуже, and how awful – it DOES WEIGHT!
pity, that in Silantyev's journal this function has not yet been taken into account, I had to work with pens for half an hour, but this, чёрт возьми, worth it..
so, know a little about working with tables, сортировкой, fetching data in excel – need to. it turned out, it's not that hard, that's why – do not be alarmed..
what we do:
1. take all negative trades and take the entry price for each negative trade
2. the same for the plus
3. put in two separate tables
4. we start sorting by price ranges for minus: $1-10, $10-20, $20-30, $40-100
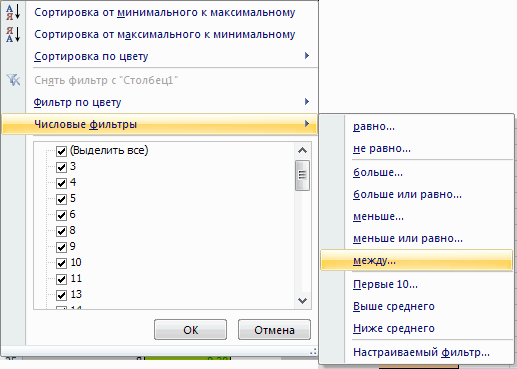
it turned out like this for me, because deals with stocks are more expensive $40 turned out to be the least, so I covered them in one group. for that, so that the table produces a selection for the desired range, we need to get into such a menu:
and drive in the desired range one by one.
then select the selection and put it into a new mini-table, accordingly, I succeeded 4 mini tables: all moose in the range 1-10, Then 10-20 etc..
It's cool! now we sum up all the losses for each sample.. опа! you can immediately see which segment is worse. but that's not enough.
5. we do the same for positive trades and also divide them into mini tables with samples of profits, sum them up for each range.
6. here it is! we calculate the profit factor for each range and specifically enlightened:)
Let me remind you how PF is calculated = sum_all_profits / sum_all_loss.
good if the profit factor is greater 1.2, poorly, if less 1 and it's terrible if in the area 0.5
my case – absolutely terrible profit factor (0.6-0.7) for transactions in the segment 30-40 and higher 40..
WOOOW! I immediately thought.. means my trading can become more efficient, if i stop reserving more expensive shares $30.
the circle narrows – concentration rises!


