pattern

Cryptostrateg predicts new highs for DOGE and BNB

Crypto Strategist Smart Contracter Expects New Highs For Dogecoin (DOGE) и Binance Coin (BNB) In his opinion, we should expect a sharp rise in the Dogecoin rate to $1, that is, it is possible to predict a potential increase of more 270% from current levels.

Diamond Reversal Figure in Technical Analysis

What is this figure Diamond Figure "Diamond" (from english. – «Diamond») also called "Crystal", "Diamond", "Rhombus". The formation consists of two configurations - divergent and symmetrical (converging) triangles.

strategy price action

13 May, 2021 Ignat Terentyev Strategies 0 EURUSD, H1, a deal to buy on the "hammer" Contrary to the stereotype, popular with novice forex traders, Price Action is not a trading system, and, rather, trading style, based on some candlestick analysis patterns. Himself

LAYERING PRACTICE: IMPLEMENTATION MECHANISM AND LEGISLATIVE BARRIERS

Layering – this is a high frequency trading strategy, where does the trader do, and then cancels orders, which they never intend to carry out in the hope of influencing the share price. For example, to buy shares at a lower price, the trader first places orders to sell at or below the market price High Frequency Trading, depending on the strategies used, has a different effect on the market condition. Some of them are draining liquidity from the market, other – add liquidity to the market. Many of them are the cause of sudden unexpected movements in market quotations., and also generate new borderline methods of unethical, and sometimes illegal income generation on stock exchanges. Such a controversial practice is the layering method., the essence of which is to create the possibility of artificially shifting the quotations of purchases and sales of securities in order to force the rest of the exchange market participants to make a profitable deal for the manipulator.

Technical and Fundamental Analysis of Cryptocurrency Trading. Features and tricks

2017 the year was marked by exponential growth of the cryptocurrency market, whose dynamics amaze the imagination. Many in the past year were once again convinced that, that the profitability of investments in new assets is often more attractive than the results of investing in shares of even the most successful companies. The prospects for obtaining significant profit on invested funds attract more and more new participants to the cryptocurrency market, including famous players in the world of traditional finance.

Into the piggy bank for a crypto trader: Japanese candlesticks and patterns based on them

Anatomy of Japanese candles As you know, Japanese candlestick chart is very popular among traders in all markets. Let us recall again, what are Japanese candlesticks. Each candlestick on the chart reflects price movement during a specific timeframe. The body of the candlestick is formed by the opening and closing prices, and shadows are highs and lows. The upper shadow of the candlestick is a vertical line, showing the difference between the high and the close for a bullish candle and the difference between the high and the open for a bearish.

SMB Capital Day Trading Course Review

1. Course description The trading course from SMB Capital is focused on intraday trading of stocks in the American market. Day trading strategy is based on analysis and selection of active stocks, technical analysis, tape reading and risk management. If you trade other markets, you can still find useful tips for technical analysis in this course, position management, risk. The article will describe intraday trading strategies, basic models and trading instruments. Courses from SMB Capital will give, certainly, more knowledge and skills. They involve communication with successful traders., analysis of your trade, use of specialized software from SMB, etc.. But the courses are worth going, when you are sure, that you want to trade in this particular market and in exactly this style. The article gives a working strategy, having tried which, you can understand, is the American stock market right for you and this style of intraday trading?.

Mark Douglas - Reason over the Market (interview)

Mark Douglas - Reason over the Market

From the translator: Greetings! We offer you a translation of an interview with Mark Douglas, an experienced trader and a professional in the field of trading psychology, author of the books "Zone Trading" and "Disciplined Trader", That, sure, many are familiar. Mark will tell us about, what is important to avoid in trading, what to strive for psychologically, and also describes the human component of the price movement. I wish you pleasant reading and a successful trading week.!

Flag Pattern - Continue Explosive Movement

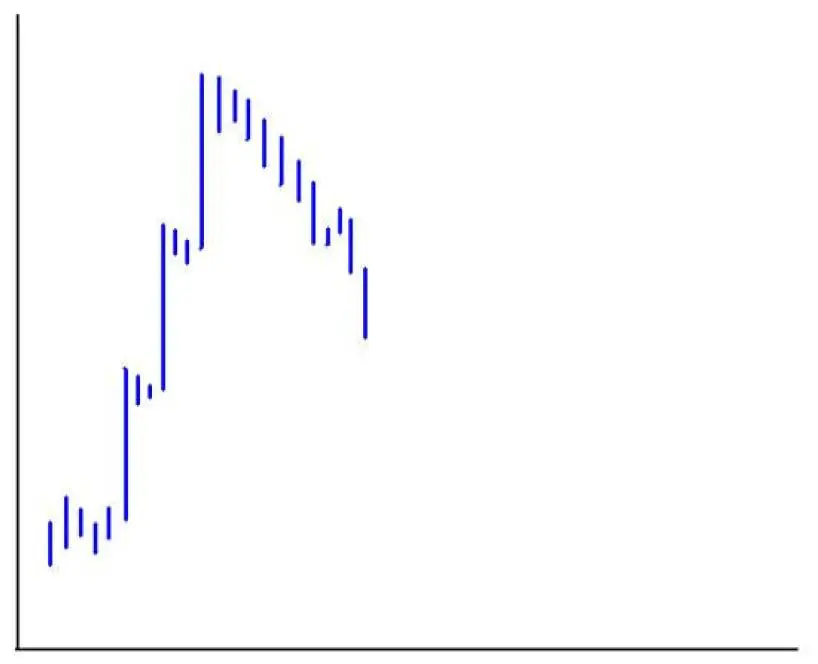
We continue to publish material from the archives Bullish patterns of trend continuation Bullish variants of such patterns appear in the middle of an uptrend. Explosive movement is indicated by speed and dynamics of movement. Ie. When 20$ stock moves up 70 cents and more, behind 1-2 minutes. This setup can be traded long, so in shorts. Beginners should focus on trading longs. This pattern usually develops, because hot news is coming out. Consequently, the market has little impact on this pattern.. What does this type of movement look like on a chart? On the 1 minute chart, you will see a large vertical explosive bar. The following 1-3 bar will be much smaller. If, after an explosive movement, the stock has a small pullback and begins to move in a small range, then in most cases, after this range, the stock will go up. You should never enter a trade on an explosive vertical bar. Wait for that moment, when the stock calms down and begins to consolidate. This will give you the best risk to reversal ratio.. This pattern indicates a strong upward momentum. Usually a market order for an offer is entered into this setup., and limit orders are also issued for the offer. Any flag and pennant ends in "LowerHigh". It is easy to fool yourself when trading this setup., confusing "LowerHigh" with another explosive movement. What do you expect from the next upward move? If the first …

Flag Pattern - Continue Explosive Movement Read more

Stock Reporting Season ( Earnings Season ) – 14 useful tips

Earnings Season (Reporting season ) provides us with most of the opportunities for profitable trades. This is our final series of games. It looks like Opening, repeated every day for six weeks and four times a year. Every day is new. Every day is special. Every day is delicious. Every day offers tremendous opportunities. This is our favorite time to trade. Below are some suggestions for, to help you maximize these opportunities during this Earnings .

Scroll to Top