1. Course Description
The trading course from SMB Capital is focused on intraday trading in US stocks. Day trading strategy is based on analysis and selection of active stocks, technical analysis, tape reading and risk management. If you trade other markets, you can still find useful tips for technical analysis in this course, position management, risk. The article will describe intraday trading strategies, basic models and trading instruments.
Courses from SMB Capital will give, certainly, more knowledge and skills. They involve communication with successful traders., analysis of your trade, use of specialized software from SMB, etc.. But the courses are worth going, when you are sure, that you want to trade in this particular market and in exactly this style. The article gives a working strategy, having tried which, you can understand, is the American stock market right for you and this style of intraday trading?.
2. Selection of active shares
Search and selection of active shares (or, as they are called in SMB, "Shares in the game") Is the basis, on which the strategy is based. The quality of your trading will greatly depend on the quality of the stocks you select.. There are several advantages to trading such stocks.:
- "stocks in the game" can make strong unidirectional movements and form understandable formations;
- the price movement in such promotions is cleaner, with less "noise" due to the presence of large players and less robotic influence;
- with an increase in the volume in an active stock, volatility increases and, respectively, earning opportunity, because. movement potential increases. If there is news in the promotion, she can move in 2 times ATR;
— stock in Game (especially in report season) can give 2-3 entry points throughout the day with a good risk / reward ratio. For example, even if you missed the first strong move, after a rollback, you can follow the trend, and you can expect the second, movement of about the same magnitude, like the first;
- opportunities for momentum trades appear in the stock, which can give significant profit in a short time;
- high liquidity makes it possible to enter the instrument with a large volume. Increased volume, Besides, talks about, that the news is real. Increased volume is an additional signal, who says, that stock can be trusted;
- in stock, in which major players have appeared, easier to read the tape and look for confirmation signals for entry on the tape;
- important news in the "action in the game" works as an additional signal for entry, which increases your advantage in the deal, in such trades you can take a position with a large volume.
We must not forget, that "stocks in the game" have their own "expiration date". If the promotion has been active for a week, then her movements may already be dirty, fuzzy. You need to look for interesting stocks constantly and regularly update the list of traded securities. Can, certainly, concentrate on trading company stocks, who are currently in the spotlight (for example, Apple, Tesla), And, using 1-2 trading patterns, make stable money on them, but you can find much better paper on the market every day, them charts will be less noisy, with clearer formations and an excellent risk to reward ratio.
What qualities should a "action in the game" have?? In-game promotions are promotions, in which something happened, what did not expect, what is different from previously made forecasts.
Active shares can be found among securities, which:
- income or income forecast turned out to be worse or better than expected;
- the profit turned out to be more or less than the planned. There has been a change in the company's earnings forecasts for the next quarter or year (important, when the company's forecast differs from the analyst consensus). News about the change in margin has been released;
- news, which led to the fall or rise, turned out to be exaggerated or incorrect;
- strong changes in trading volume. You can watch stocks with a strongly increased volume for the previous day or during the trading session;
- increased trading volume in the premarket or after the close of the main trading session;
- significant price change on the postmarket and premarket. A very good signal to buy, especially in the season of reports, is something, that the share price rises on the postmarket (for example, after the report), and at the premarket rises even higher. It's very good pattern long from post levels- or premarkets;
- strongly fallen or increased stocks, where you can expect a technical rollback;
- rumors about the purchase of the company. If there are such rumors, it is also worth watching the shares of companies from the same sector.;
- investigations, company courts;
- high short interest (more 20%);
- stock, whose prices are updated by the hai. Promotions, which stood in the range for a long time, and prices are now ready to upgrade high or low;
- release of a new product, which was not expected. Need to understand, that some news or company information cannot be accurately assessed. It may take longer, for the news to affect the value of the share. For example, if the product is new, then it is not known exactly how successful and profitable it will be;
- change in the company's market share;
- transition during drug testing to "phase 2" or "phase 3" ("Phase 3" is more important) from pharmaceutical or biotech companies;
- upgrade of the company's assessment by analysts of banks of the first and second tier. More than one upgrade in stock;
- the company goes to IPO. You need to look at the estimated value of the stock and how the paper behaves around this price at the beginning of trading.. The stock is not limited by levels and can go well, a lot more, what do you think;
To select stocks by filters, there are a large number of resources for news. Finviz, Yahoo finance, Russian-speaking Stock-watcher. There are resources, where you can see the prices on the postmarket for free, for example, NASDAQ.with, thestockmarketwatch.com. SMB provides access to its SMB Scanner for relatively little money. In trading, you do not need to spread over many stock. You need to take away 1-3 paper for the day and focus on one good deal, then on the next.
3. Technical analysis
Need to understand, that a set of instruments and signals works in trading. Stable profitable trading depends on the correct selection of stocks, news analysis, technical analysis, tape reader, risk management. Technical analysis alone is not enough for successful trading. According to SMB Capital lecturers, no indicators, oscillators, candlestick, graphical models provide no statistical advantage. Many trading models, which are described in the books, at seminars, look good only on history. On history you can find confirmation of any models, but in practice, at the right edge of the graph, the situation is completely different. But there are universal principles, which work and which are the same for different markets and different timeframes. These principles according to SMB are as follows:
- the markets are in a trend phase, phase of the range and the state of transition from one phase to another;
- trend, probably, continue, how will it end;
- a trend can end in several ways. It could be an accelerating vertical movement., smooth slow parabolic rounding with several vertices, or the price stops and consolidates in the channel;
- if the price quickly moves away from the level, then the level, probably, will be withheld, and if the price consolidates for some time near the level, then the level can be broken. Pay attention to the calm market near important levels. This could mean preparing for a breakout..
In technical analysis, it is important to determine, in which condition (trend or range) there is a market. You need to choose the right model to enter, because. models, working in the trending market, do not work in ranges. At all, there are only four scenarios of price movement in trading:
- if support or resistance breaks through the trend, then the trend continues;
- if support or resistance is trending, then the trend ends;
- in a trading range, support or resistance is held;
- in a trading range, support or resistance is broken;
On practice, Unfortunately, more and more complicated. There may be false breakouts, shifting trading ranges, when the level breaks, but only for that, to expand the range (You can read more about this in the article about the Maitrade strategy). It can be difficult to distinguish between a range shift or channel expansion and the beginning of a new trend.. Trading ranges seems easy just by looking, yet again, on price history.
SMB Capital courses advise look for trends and follow trends - these are the simplest and most reliable deals. At the point of a potential start of a trend, you can first try a fast momentum trade, the second entry point may be after the formation of the first pullback in the direction of the trend. In my experience, trading with a trend after the first pullback is the most reliable pattern.If there is news, then the second move after a pullback can be just as large in the stock, like the first.
It is much safer to trade the pattern “after a trend retracement”, how, for example, try to make counter-trend trades after the end of sharp vertical movements. There are two risks to such movements.. The trend may continue against your position or the trend enters a range phase, and your position will be inside the channel. If you are trading breaking the trend, then there is no need to rush and try to be the first. Wait for confirmation in the form of savings, retention levels. Avoid countertrend trades in trending markets. Also avoid channel trading, in which there is no potential for price movement. At the beginning of your training, focus on the skills of distinguishing between trend and channel., learn to trade with the trend first.
The seminar teaches you to use the simplest things as tools for technical analysis.. Clean schedule, horizontal levels, trend lines, volume histogram. But there are subtleties in their use.. Technical analysis starts with higher timeframes, from weekly, daily charts. Important horizontal levels and trend lines are transferred from higher timeframes to lower ones. These seniors, important levels are used within the day. Intraday charts are used 1 minute, 5 minutes, 15 minutes, and the timeframe changes within the day. This is an important point, which we will talk about in more detail below.
Hays are considered important levels of higher timeframes., places, from which strong movements began, borders of gaps. This is similar to Approach A. Gerchik, which I wrote about in the articles "The course of an active trader. Review of the seminar of Alexander Gerchik "and «Trading from A to Z with Alexander Gerchik for 60 days. Course overview ". Read more about the important levels in these articles.. We look at the daily charts, how much rose or fell. How intense were the rise and fall. Above or below the level the day closes. Opening points, closings of relatively strong levels are very important.
As an example, consider the AAPL chart:
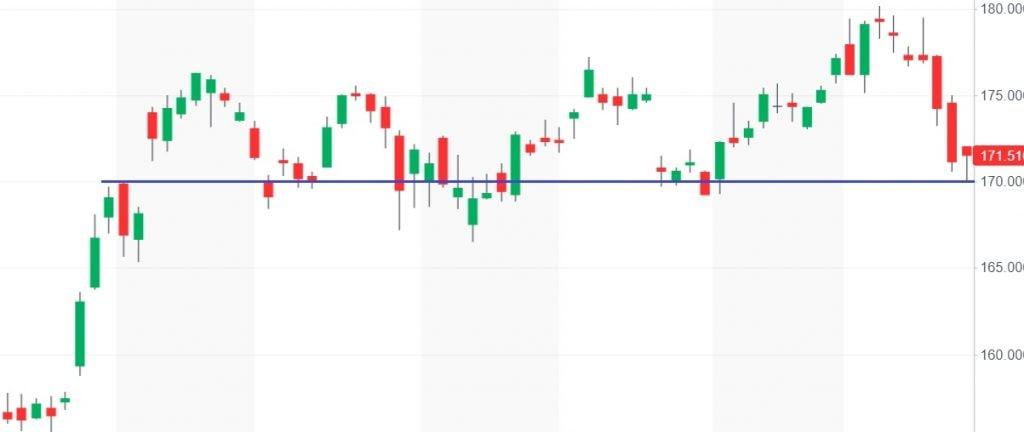
Level 170 was the border of the gap, strong movements started from it several times. When approaching this level on a smaller timeframe, we see, that the price bounces off it quickly:
Good signal, if the price moves away from the level on increased volume. In the example, we do not see too high a volume., maybe because of lunchtime. It is seen, that the price does not reach 170. Levels should be treated like ranges, need to watch, how the price behaves around the level.
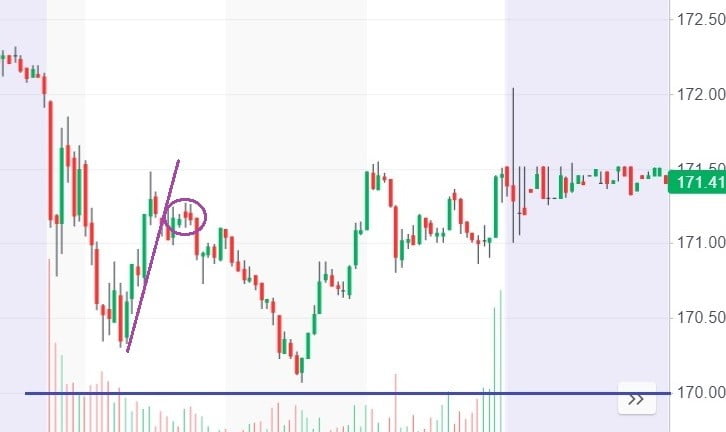
By the way, in this example you can see, how many times can you enter the promotion, if you trade it with the trend. From the opening, you can make a momentum trade with a duration 5-10 minutes to break through the low premarket level, then the entry point on the first rollback and then on the second rollback. Although the example of the AAPL plot is not very good, it is too noisy and the action is expensive. I marked the most suitable place to enter on the second pullback with an oval. Rollback in progress, then the uptrend breaks down. After breaking it is formed consolidation, where we enter. We put a stop on a part of the position for consolidation, and partly for a high rollback. It is necessary to look for such consolidations after breaking the trend. Now I want to convey the idea of, what is important to trade a trend. Promotions, trending, give multiple entry points per day, especially in the season of reports.
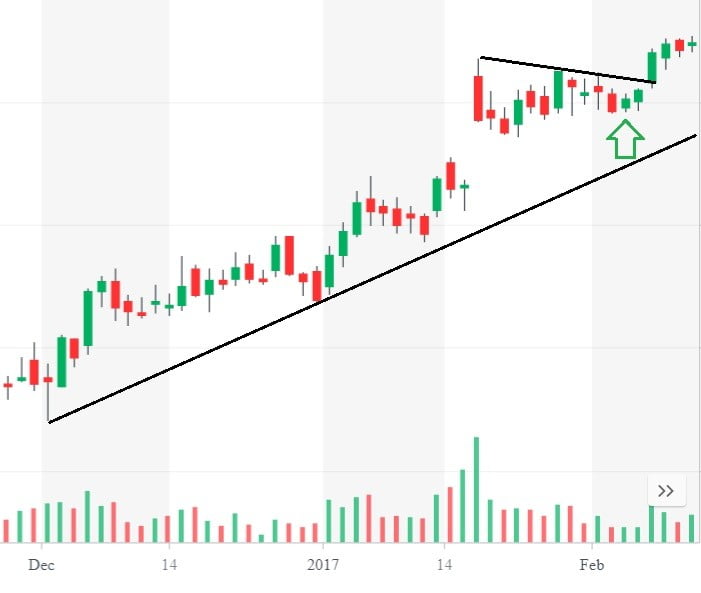
On the charts, on all timeframes, you need to pay attention to the places where the range is squeezed and "inside bars", ie. narrow bar, the high and low of which is inside the high and low of adjacent bars. Often these are places, where the price unfolds. Gotta watch, where does the bar close, following the "inner bar". Example on a daily chart:
Example on a 15 minute chart:
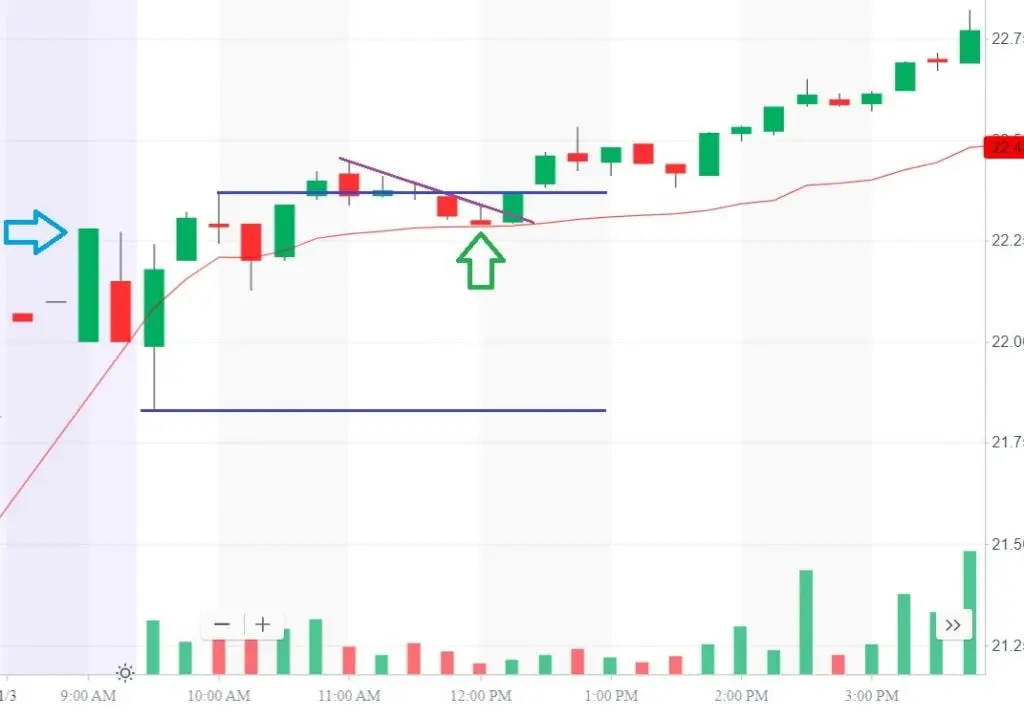
There are several important signals on the 15 minute chart. Because. we are looking at the entry point closer to lunch, then we work with a 15-minute chart. The price is above the premarket high (blue arrow), near the upper level of the opening range (blue lines). Above the red line VWAP (Volume Weighted Average Price). This is the only indicator, which was used in the workshop. Small downtrend line breaks (purple line). An inner bar is formed (marked with a green arrow). Entry on the next green bar on the breakout of the upper level of the opening range. Stop under a pullback or slightly lower, on 22.2. We'll come back to the "inner bars", when will we consider trading models.
4. Trading models
In general terms, the algorithm and model for trading are as follows. We select stocks from filters and news, which we like on daily and five-minute charts. The daily chart should have a power reserve to the nearest levels, and the five-minute schedule should not be too noisy. We look at the daily chart and mark strong levels on it. We go to a five-minute. We mark the levels from the daily chart at the 5-minute mark. Next, mark the high / low levels on the postmarket on the previous day and the high / low levels of the premarket.
We set a one-minute chart at the opening, and when breaking or holding post / premarket levels, you can try to make a quick momentum trade. Hold position 5-15 minutes, And, if the price went against you, need to close immediately.
After 9:30 go to the 5-minute chart. Further, the price can form a range at the open. These first highs and lows of the day are also marked as levels.. Open range boundaries and post / premarket levels are important for intraday trading. We look, where these levels are relative to the strong daily level, we look, where the price consolidates after the range is formed at the opening. If under the range and under strong levels, then short from the top level of consolidation. In the example, consolidation under the low of the opening range (marked with an oval):
Consolidation may be ahead of the opening range level. We go on the breakout of this level, stop is set for consolidation.
Unfortunately, clear criteria, how to mark the opening range correctly, No. Conventionally, this is the high and low of the price range in the time interval with 9:30 to, about, 11:00. It is better to consider these levels by examples.. For example, WMT stock (Wal-Mart). 25-th January 2018 she had a historical high, 26-On January 1st, a few hours before the market opened, news broke of a joint venture between Wal-Mart and Amazon in the japanese market. A week before the news there was an upgrade from Citigroup from “neutral” to “buy” and a price upgrade from 106$ to 117$. Good news background, at the premarket price update high:
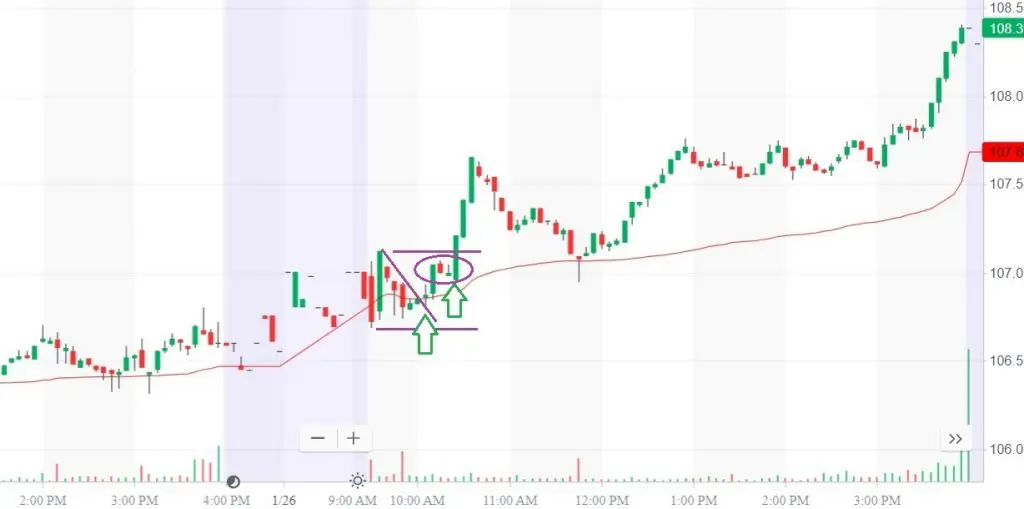
For the first time 30 minutes within the range there is a small downward trend, it breaks (first green arrow), further, the price forms a small consolidation in the upper part of the range near the level. The courses mention, that the middle of the range is also an important level. Ie. now consolidation is forming in the upper half of the range, above this level. Buyers control the price. On the daily chart, the trend is up, good news, price above VWAP, there is a consolidation, under which you can put a short stop, start of the day, ie. you can still make a momentum trade. Also watch, how the market behaves as a whole, the stock is stronger or weaker than the market, how leading stocks from the same sector behave, how does it behave ETF for this industry.
The entry point is marked with a second green arrow in the consolidation. We open part of the position, stop for consolidation. Another part is opened on the breakdown of the upper border of consolidation based on the momentum trade, short stop below the upper level of the opening range, indicated by a purple line. Part of the position, for momentum trade, close, when the price slowed down. We took some of the profits, so that she will close the risk. Ie. now we can safely hold the rest of the position in anticipation of a large movement. Even if we follow the foot, then we will not get a loss on this security.
At lunch, the volume decreases, more robots on the market, And, so as not to trade in noise, need to go to 15 minutes. IN 12:00 in WMT, go to the 15-minute chart:
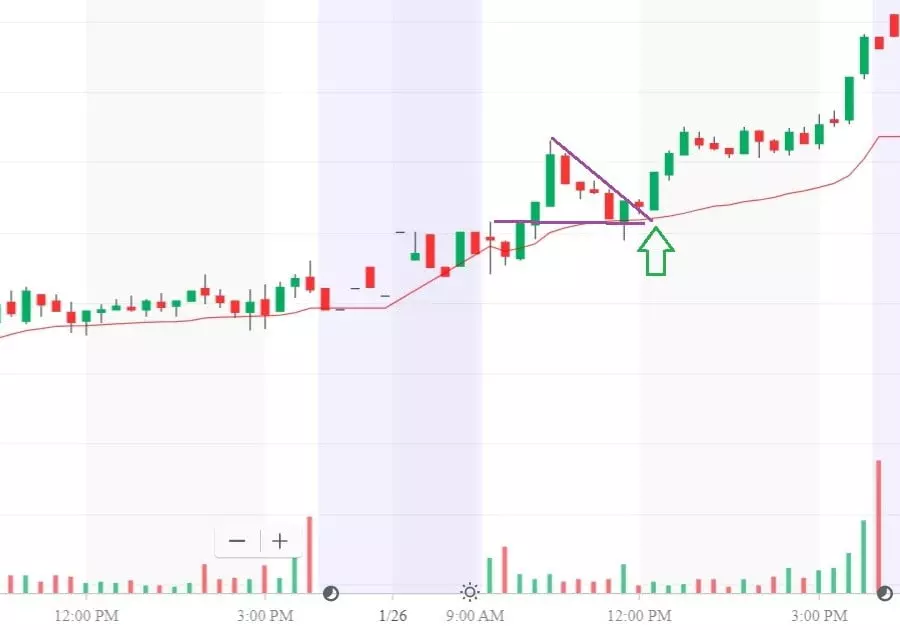
There is a decline on the chart, which looks like a rollback. Then the trend breaks, there is a narrow bar, price above the opening range level, above VWAP, and when the price moves above the narrow bar, we enter. Because. it's the middle of the day, then volatility decreases, risk of, that at lunch the price will move in the range, increases. The stop is larger due to the use of the 15 minute chart. So that the risk in dollars per position is adequate, the volume in transactions at this time is reduced. The volume in deals at lunchtime is 50% on the volume of morning deals. Also, a reduced volume should be traded at the premarket..
The courses teach, that when trading intraday, you need to use different timeframes. With 9:30 to 10:00 we trade on a 1-minute chart, with 10:00 to 12:00 by five minutes, with 12:00 to 14:00 15 minutes, and after 14:00 go back to 5 minutes and trade on it until the close.
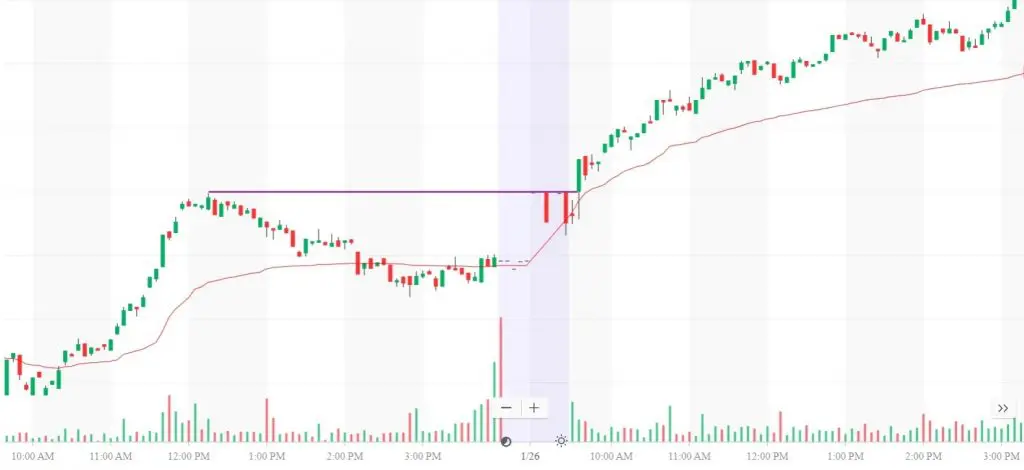
Once again, I would like to say about the importance of the postmarket and premarket levels.. The trading model is based on working with these levels., which works especially well in the report season. Let's analyze this model using the example of the INTC stock (Intel Corporation). After a good quarterly report on January 25th 2018 the stock rallied in the postmarket and continued to rise in the premarket on January 26th. Profit has grown more, than expected, increased revenue, computer sales in the US market grew more, than expected, due to the significant growth of the data center segment. In the postmarket, the price broke for a year (ie. we are above a strong level from the daily chart) and is at the maximum for the last 17 years.
The stock could be bought already at the premarket, from the high level of the postmarket, as well as trade at the opening as a momentum trade on the breakout of the high premarket. Then there is a good point to enter the continuation of the trend after a slight pullback to the high level of the premarket:
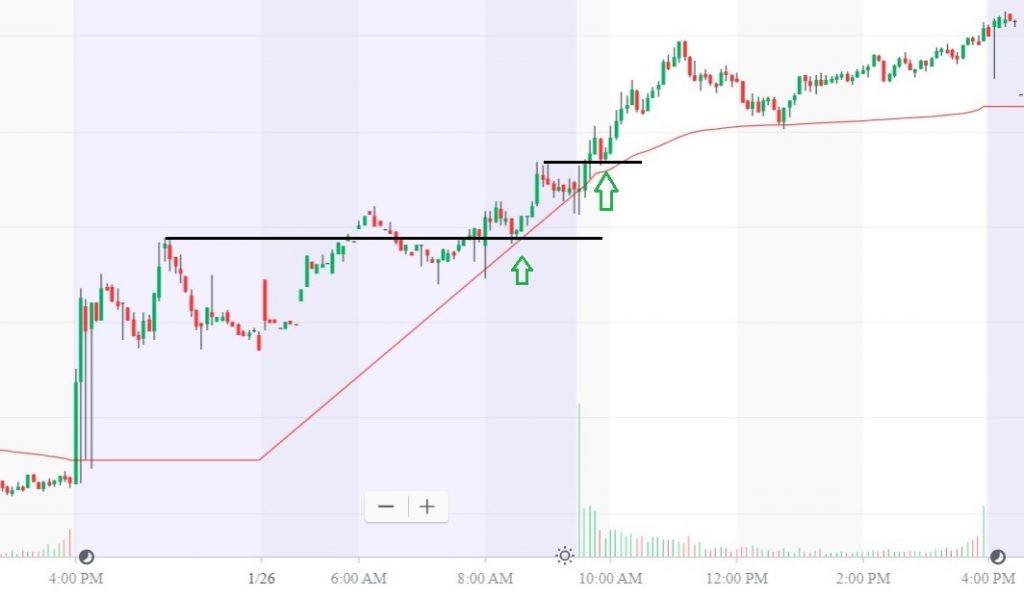
The model would be even stronger, if the price on the premarket did not go below the level of the postmarket high.
It is worth leaving the position in parts. If we follow the trend after a pullback, then the part can be closed when the price breaks through the previous high (we cover part of the risk), and keep the rest of the position, until the trend breaks.
The presence of a pullback in a trend is a good signal. Stock on volume went up, then, without volume, it began to decline, does a rollback. Further the downtrend breaks down, and the price goes up again. It means, that people are ready to buy more. But if there is no retracement after the growth, but there is a long horizontal consolidation (especially after 10:00), then it could mean, that sellers could take control of the stock.
A little more should be said about momentum trades.. This is usually the morning trade before 10:00. First 15-20 minutes from opening or in the middle of the day, when some news came out. Identical models work differently in the morning and at lunchtime.. Understandably, that the probability of a successful momentum trade from the opening is higher, than at lunch. We trade momentum, when there is news, there is a level on higher timeframes, which is being held, there is an opening range level. For example, RHT promotion 26.01.2018:
24-On January 1st, there was news in the stock - an upgrade of analysts with a buy recommendation. 25-the stock went up, updated the high for the last 18 years. At the premarket on the 26th, the price traded around the high. At the opening, the price does not fall even in the first 15 minutes out of range, breaking through an important level. If after breaking through there is no strong movement, then you need to sell the entire position at once.
Momentum may be when the trend breaks, maybe in the afternoon, if there is a large volume and news. If in the momentum trade in the morning we took a good move, then you can try to close half of the position, and then, after a pullback or consolidation, add to the position in the expectation of a large trend movement.
In conclusion of this section, I would like to say about the evaluation of transactions. Every deal, before committing it, graded by points. Model availability - one point, indexes in your direction - one more, key stocks in your sector are moving in your direction - another, strong level, there is potential for movement, there is an increased volume and, respectively, increased volatility, large buyers / sellers on tape, news, the right time of day to trade, price above or below VWAP, Sector ETFs, etc.. Signals strengthen or weaken the position. The volume of the transaction depends on this.. Strong trades have more volume and risk (in dollars per position), and in the weak less. If we are in position and the number of points increases, then you can try to increase the volume, and if the number of points decreases, then the position begins to decrease.
You must have a plan for the deal before the start of trading.. Should be clear, from what strong level we go (this is the price and you have to wait), where will stop, to what level can the price go. It is important to draw up a plan before trading., because. you are still in a calm state. During the bidding, your psychological state will already be changed, and you may not always be able to adequately assess the situation. When you trade according to plan, your psychological state is more stable.
5. Reading the tape
Reading the tape is no less important tool than the same technical analysis. Actually, the tape is the same graph, only with the smallest timeframe. On the tape you can see in detail, how the schedule is formed. Who is stronger, how volumes are formed at a certain price level, how levels are held or broken, how aggressive buyers and sellers are.
We need news for a good deal, clear model on the chart, which gives an entry point with a risk / reward ratio of at least 1:3, and login confirmation on the ribbon. News, technical analysis and tape are related things. After the news (especially in the season of reports) large volumes appear, big players. The action becomes less noisy, more trendy. When big players appear, the activity of robots begins to subside, it becomes easier to read the feed and look for confirmation on it. You can and should also watch the tape at the premarket., because. at the premarket, vice versa, robots are disabled due to low trading volume.
The tape should be watched at the pivot points, on breakdowns, in places, where the stock slows down. You will quickly see on the tape - this breakdown was real or false. When making momentum trades, when trading from the opening (at least the first 20 minutes from the beginning of the session) tape is the main tool. Paradoxically, tape is easier to read, when there is volume, and when she's fast, not at lunch, when the stock does not move. At the opening, when fast movements occur, tape helps control risk. After hepa, the tape also helps to understand, who controls the situation in the action.
When analyzing the tape, we must look at:
1. Bid prints, ascu prints.
If you see prints on a bid and then prices go down, this is a sign of weakness.. If the prints go up the ask and prices go up, then this is a sign of strength. Constantly passing prints on offer is a signal, that someone really wants to buy this stock. Gotta watch, what does the stock do after that. If you see a large number of bid prints, and the bid is holding, the volume on it is updated, then this is a big buyer, we can buy too. We also look after the moments of analysis of such large buyers / sellers, after that, the stock may start a strong movement. See, what size prints were taken apart by major sellers / buyers.
If we see a lot of deals by bids and offers on the feed, and then the price goes down, it means they sold in this place, and the sellers won. On the tape you can find out, in what price ranges the action is controlled by sellers and buyers. Whether the stock then goes above or below this range. As on the chart, we look at the levels, which are held, so we look on the tape, at what prices it is kept. If we see red prints, and then the price goes up, then this is a strong situation, buyers won. If, for example, red prints are coming, the price goes down, and then returns to the previous price, then it is very good to buy. If on the ribbon we see a decrease in volume on prints at a certain price, then maybe a shot.
2. Large print at a certain price.
If you see a print with a lot of volume, then this is an institutional purchase. You need to remember these prices and observe, what happens next about this price, higher or lower the paper trades, which way do the prints go.
3. Large print, and then the big print above.
On the ribbon you see a print with a lot of volume, then another print at higher prices. It shows, that institutional players are willing to pay higher prices. Stock could move higher. This signal is especially useful for identifying a pivot point. For example, share falls, and you see a big print, and then another big print at higher prices.
4. Changing the belt speed
For example, ribbon prints on offer, then the speed of the tape is accelerated, she types faster on suggestion. This could be a bullish signal, someone wants to complete a large purchase order. Or, for example, you see slow prints on offer, but when prices go down at these prices, they instantly buy. It could be a signal of strength. If the ribbon slows down the speed of prints or you see, that there is a low speed in the tape, then it could mean, that the stock is “not in play” and you need to look for another instrument for trading.
5. Volume at a specific price
Watch the prints, to determine, what volume was traded at a certain price. When you see an unusually high volume, bargained for, then this price becomes an important intraday level. We trade from these levels. The more volume was traded at a certain price, the stronger the movement can be expected, when the stock moves away from these prices.
6. Risk management
First of all, you need to determine the daily loss limit. The amount of losses is set in dollars. The volume in the transaction is counted from it.. Deals, depending on the quality of the input, fall into three categories. Category A is the best trades according to your model and set of signals in your direction.. You must do the categorization according to the number of signals yourself., based on your style and trading strategy. The size of the risk varies depending on the category, which you can take in the deal:
A trade - 25-30% from the daily loss limit.
B trade - 15%.
C trade - less 10% from the loss limit.
The risk is also adjusted using stops at different levels., opening and closing a position in parts. If your position is positive, then you can close the part, thereby close the risk in the transaction, and then with the remaining risk-free position, they are already trying to hatch a large trend movement.
Hope, this article was interesting to you and you found useful tools for yourself.
Original article: https://tradinglab.tech/trading/obzor-kursa-po-dejtrejdingu-ot-smb-capital.html