On the main page of the site Finviz.com can see charts and the values of three popular US indices: Dow Jones, NASDAQ, SP 500. There is also a brief filter information on stocks., futures, currency pairs, latest news. All information is conveniently divided into blocks. Above all information is a menu bar, for a trader, the most interesting tab is Screener to search for stocks by fundamental and technical indicators of stocks.
News
The menu link next to the main page is called News, whose name speaks for itself. When you get to the news page, you will see 2 Column: the first is the news feed, which are published by the main news agencies, CNN, Wall Street Journal, The New York Times и т.д.; second - blog, this shows the entries of the main financial blogs in America. As for the news, not very convenient then, that you can read the news in full only by going to the site of the source of the news, however, sometimes the title speaks for itself. By the way, no need to refresh the page while waiting for news, the site updates it automatically.


To start, worth saying about, what a resource Finviz - this site, where we can monitor not only the stock market and follow its updates, but also the futures market. This allows us to quickly evaluate certain products., currencies, indexes and much more. Thanks to, that the service supports many automatic filters, with the help of which you can simplify the compilation of a list of shares for subsequent analysis, finvis enjoys huge popularity everyone has professional Traders.
I suggest you get to know a little about the sections of the site, which we see on finviz.
News
The section contains the latest news, received in real time from the best news agencies and collected from all kinds of financial resources.
Screener
The main section of the site, to which special attention should be paid to the topics, for whom investing in stocks is the main source of income. It is in screener that we will select stocks for trading on NYSE, AMEX, NASDAQ.

In total in this block you can filter and analyze the order 7000 companies, whose securities are traded on the above platforms. In this section you will find many different filters and scanners, and therefore we will pay more attention to him, but a little later.
- My Presets – this tool is available only to registered users. It allows you to save a sorted list of securities or insert your own.
- Order – the function allows the user to sort the list by ticker (stands by default), company name, sector, country, etc. Also nearby is the ability to sort alphabetically or in reverse order, Asc and Desc respectively.
- Signal – you can view promotions only by signals, for example: New High, New Low, Oversold etc.
- Tickers is the last function on this line, makes it possible to find a security by ticker. Next comes the second line, where different filters can be used.
- Descriptive - filter by description, Fundamental - fundamental filters, Technical - filters, based on technical analysis, All - accordingly combines all filters into one.
- Exchange - allows you to sort shares by exchange: AMEX, NASDAQ, NYSE (the default is the parameter - for all markets).Market Cap. - sorting by market capitalization of the company.
- Earnings Date - sorting by quarterly report. Various options presented, for example: Today (today); Tomorrow (tomorrow) etc. Index - allows you to select stocks, included in 2 popular US index S&P 500 или Dow Jones. Dividend Yield - sorting by dividend yield.
- Average Volume - sorting by average stock trading volume per day.
- Sector - sorting by sectors.
- Float Short - allows you to sort stocks, who are in shorts.
- Relative Volume - shows the ratio of current volume to average intraday volume for 3 months.
- Industry - sorts stocks of companies by industry.
- Analyst Recom. – sorting by analyst recommendations, for example: buy, To do nothing, sell. In my opinion, this is not a very useful filter., since building trade on the opinions of strangers is not a good thing.
- Current Volume - sorting by current trading volume for today.
- Country - will show the shares of the company, located in a particular country.
- Option/Short - will show stocks for which there are options / which can be short.
- Price - sorting by price.
Fundamental tab will be most interesting for investors, in short it can be said, which allows you to filter stocks by various fundamental indicators. They are described at the beginning of the post.
Technical tab:
- Performance - sorts by stock performance.
- 20-Day Simple Moving Average - sorts the position of the stock price relative to a simple 20-day moving average.
- 20-Day High / Low - sorts by highs / lows for the last 20 days.
- Beta is a measure of volatility.
- Performance 2 - sorts by stock yield.
- 50-Day Simple Moving Average – sorts the position of the stock price relative to a simple 50-day moving average.
- 50-Day High/Low – sorts by highs / lows for the last 50 days.
- Average True Range - sort by average range.
- Volatility - volatility.
- 200-Day Simple Moving Average – sorts the stock price position relatively simple 200 daily moving average.
- 52-Week High / Low - annual maximum / minimum.
- RSI (14) - sorting by relative strength index value.
- Change - percentage change. Pattern - patterns (figures) on charts.
- Gap - the amount of gaps in percentage.
- Change from Open - percentage change from opening. C
- Candlestick - candlestick shapes: doжиi, hammer, inverted hammer, etc..
Respectively, as stated above, All tab allows you to use all filters at once.
Maps
Market map, which helps us to review the changes as quickly as possible, occurred in the prices of individual shares, industries, sectors and the market as a whole. I personally find this section extremely useful., since it allows you to evaluate as global, and the detailed state of affairs at a given moment in time.
Each individual square on the map is a company. In it we can see the ticker, firm-owned, and price changes in percentage terms relative to the stock price over a certain period of time (by default, the site shows price changes as a percentage for one day). The size of the squares depends on the degree of capitalization of the firm relative to all other companies.. The color of the square shows us, what happened to the shares during the reporting period - whether they grew in price or fell. Besides, all squares on the map are divided into several sectors. Every sector is an industry, to which this or that company belongs.
You can visually see the promotions, which are divided by sector and sub-sector. Each tool is marked with a square, the value of which depends on the capitalization of the company. Also, all the squares are multi-colored., the color depends on the rise or fall of the price. You can view the market map in several categories, which are located immediately above the map.
Groups (price changes by groups)
Chapter, in which we can get acquainted with the dynamics of price changes in individual sectors and industries over a particular period of time. Access to this information helps speed up the process of evaluating a global market map.. Besides, the navigation is well thought out in the section, which makes it much easier to work with graphs, by which you can assess the current state of sectors and industries, using the main stock indices for this.
Portfolio
This section, which you can only access after purchasing finviz elite. Here you will have the opportunity to compile an investment portfolio of securities of various companies and regularly track it dynamics.
Insider
All are collected here insider trades. For reference, I will note, what people call insiders, which are directly related to companies, that is, they own, least, 10% all company shares. As a rule, top managers of corporations act as insiders.. This link may be helpful, as it shows the actions of insiders (directors, top managers). Main columns starting in order: ticker, owner, position, date, transaction, price, number of shares, the cost, shares total. Filter available, allowing you to sort by type of operation.
Futures

Chapter, which displays dynamics of price fluctuations on major futures. Here you can also view the charts of these securities..
Forex
Still the same Futures, but already foreign exchange operator.
Сrypto
Similar section, only for cryptocurrencies. Appeared not so long ago.
Backtests
Is an paid section of the siteand, in which you and I can build our own trading strategies, using filters already available in the financial visa base as a basis. Here we have the opportunity to create completely new filters.. The section is good for, that with its help we can test our own strategy on the existing history.
Service rates
A certain part of the information is provided by the service absolutely free, but for some you still need to pay. In total, there are three tariff plans for financial visa.:
- free;
- registered;
- paid.

Cost «Paid» tariff is 25 dollars a month. If you are trying to decide, do you really need finviz elite, then it makes sense to note, that its main difference from the free version is in data latency. That's why, if you want to use the site for real-time monitoring and screen companies while the exchange is open and trading is actively conducted on it, probably, you still have to spend money on purchasing the paid version. You will need a financial elite and so, who is involved detailed analysis stocks on small-scale charts with a smaller timeframe 1 of the day.
If you are interested in an exceptionally rough selection of securities for market analysis, then the need for real-time data disappears by itself, and therefore the free version of the site will be enough for us. The service will provide you with information about companies completely free of charge., futures, stock indices. In other words, You'll get everything you need for global analysis.
Basic filter parameters
Well now, as I have promised, I return to the section “Stock Screener». At the very beginning of the article, I talked about, that this block of the site contains many filters. It is to them that I want to pay special attention., after all, it is they who will help us with the selection of stocks for trading.
To view all filters, just go to the tab “All», located inside the section. If you hover your mouse over the filter name, a line with a brief description of the selected tool will be highlighted next to it. There is a list of tickers under each filter, filtration. Because the the site does not set any filters by default, then we can see all the promotions available on the website. All of them 7096 things. I want to draw your attention to the most significant of them.:
Signal
This option only allows us to see signals like Top Gainer or New Low. I immediately want to make a footnote in this place and tell, what does this or that signal tell us. This information will be useful exclusively for beginners.. If you are a pro in stock trading and already familiar with signals, feel free to scroll the page below. Well, for novice traders, I am pleased to present the following list:
- Top Gainers or growth leaders;
- Top Loser - they are the leaders of the fall;
- New High - new max level;
- New Low – new low level;
- Most Volatile or the indicator of the greatest volatility;
- Most Active - most active;
- Unusual Volume – unusual volume signal;
- Overbought or overbought;
- Oversold or oversold;
- Downgrades - rating downgrade signal;
- Upgrades – rating upgrade signal;
- Earning Before is a seasonal report, formed before the start of exchange trading;
- Earnings After is a seasonal report, post-market emerging;
- Recent Insider Buying – latest insider buying data;
- Recent Insider Selling - data on insider sales;
- Major News – hot and important news;
- Horizontal S/R – horizontal support and resistance levels;
- TL Resistance – resistance level;
- TL Support – level of support.
Average Volume
Indicator average trading volume of shares. The parameter is extremely important for, to exclude those companies from our list, which cannot boast of high liquidity. It is liquidity that determines, how quickly and easily you can buy or sell a security at the current price. If the liquidity ratio is low, there are risks of slippage, i.e, quite possible, that your price orders will be executed at prices much worse than those, for which the initial application was set. Besides, the spread also depends on liquidity - the price difference between Bid and Ask.

The greater the value of liquidity, the more competition between market makers will be. Consequently, we will get a smaller spread. Volatility also depends on liquidity. This indicator also affects the behavior of stock prices.. We can consider stocks more or less liquid, who have a trading volume over 300 000 pieces per day.
Price
Filter, allowing us to select stocks by price parameter. On the market you can find it like paper, worth a fraction of a cent, so are those, that reach in price up to several hundred thousand dollars per lot. Obviously, that each market participant has a limited amount of money, which, Unfortunately, not always enough for that, to trade expensive stocks. That's why "Price»Will set the upper limit, beyond which the price of the securities of interest to us will not go.
Average True Range (ATR)
Averaging the range of price movement per day during the last 14 days. This value is calculated as the arithmetic average of the high price of the day minus the low price of the day.. I want to note, that this parameter is very important for high-quality filtering of stocks with an excessively small range of movement during the exchange day. Everyone trader knows, what for, to make a profit, necessary, to make changes in price. The Bigger These Changes Will Be, the higher the chance of making money on the operation.
I advise you to initially select stocks for work., whose price does not stand still and moves in a range 0,5-1 dollar or more. At this point, it is also necessary to remember such a moment as expenses. Usually, the cost of moving the price of a share in 1 the deal is 2 cent. Based on this, we conclude, what if our security moves on average in 2-3 cents daily, then no effort will help us to cover the costs of a transaction with such a paper. Therefore, you just need to set the ATR corresponding limit, which will discard such companies from our list and save our time for analysis.
Market Cap
This indicator of the market capitalization of the company. Depending on whether, how high level of capitalization the company has, so does her correlation with the exchange, market sector and major indices. This interaction is very important., after all, when analyzing stocks, it is easier for us to get accurate results, if the security is influenced by a minimum of factors. In this way, we can conclude, what a big correlation companies with a market creates the need to use a much larger list of financial instruments in the analysis.
For example, if the company is included in the biotechnology index, and correlation (repetition direction) have a stock high with him, then you need to watch the movement of this index. If the index grows, then you can buy a position Long for the selected stock. In the standard filter, we excluded such companies by limiting the capitalization level to 10 billion dollars. If you want to trade just such stocks, then you can manually change the data or search for high correlations with the index in the existing filter.
Industry
Filter, with which you can sort companies by industry. The tool will be useful for, to exclude fund shares. It's all about, that the US stock market is traded as stocks of individual firms, and foundations. The problem is, that fund stocks move like indices. I.e, include a whole set of other tools. Consequently, we have to analyze the situation according to the principle of "fortune-telling on the coffee grounds". In order not to waste your time on this event, just clear the stock list, by activating the function "Stock only».
My Presets
Tool, which comes at the disposal of exclusively registered users in the financial visa. With it, you can save the list of stocks you have drawn up or add your own to the service..
Enable Presets functionality
Basically, all these parameters will be quite enough for, to form a high-quality list of securities for further analysis. You can enable any other parameters in order to, to refine your search, at will, if you see a need for them.
Filter templates
Since we know, how a specific parameter affects price behavior, create a list of stocks with a certain trend, behavior and pattern can be. In this case, it all depends on, what strategy does the trader follow. Some of them work well with stable trends and try to form a list of companies with stable growth and low volatility., others trade using the pump and dump strategy, working with cheap securities and form a list of extremely cheap securities, which are characterized by a sharp increase in short periods of time.
Algorithm of work
- Unload from the paid version table in Excel format with specified filtering options;
- Go to the tab "Tickers"And copy the entire list of tickers in it.
 We transfer this list to our table or immediately load it to the trading platform;
 - As a result of filtering finviz will select a certain number of shares for you, that meet the requirements you specified;
- To use a ready-made filter, simply follow the link.
If you followed this instruction strictly, then here, what should you have done:
- From the list were excluded funds;
- We left on the list only shares of American companies;
- list has been cleared of highly correlated companies;
- Received a list of companies, who have sufficient potential for both growth, so for the fall;
- Excluded from the list of companies, which have low potential for average movements at relatively high trading costs;
- Got rid of complete illiquid assets.
It turns out, that in a matter of minutes we went over 7000 companies and weeded out those, what are not suitable for us for trade: have too high risks in trading or require too complex analysis. From the remaining companies, we have compiled a list for every day. It is with him that we will work in the future.. Every day, with the help of additional filtering, we will select individual companies, to trade their securities throughout the day, weeks or months.
Additional parameters
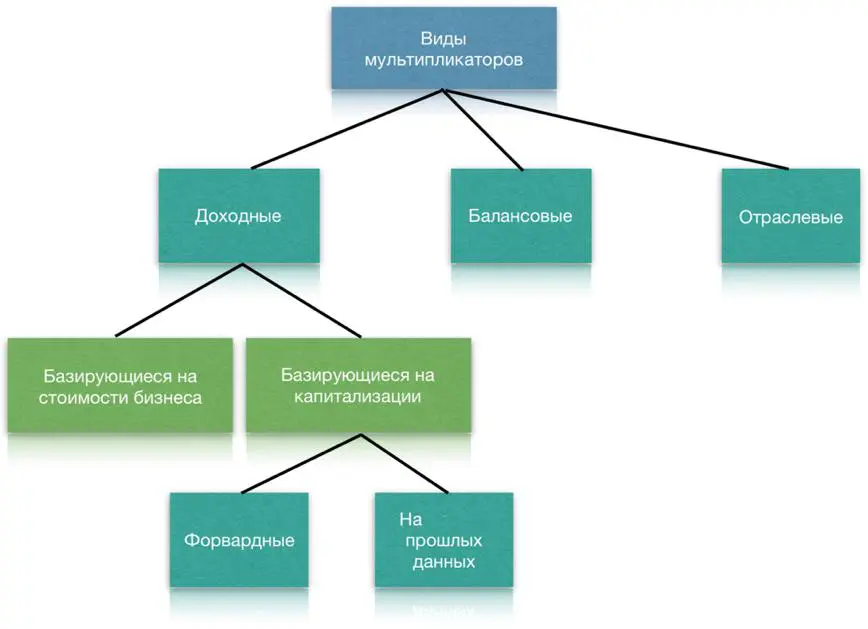
Price multipliers
For that, to narrow the search range as much as possible and find only those stocks, which are traded at an adequate price, I advise you to install filters with such price coefficients:
- Price/Profit ratio or (R / E) should matter below 15. P / E ratio, equal 15 tells us, that the valuation of the share is fair. If the P / E gets higher 20, then this indicates that, that the company is overvalued;
- The price / book value ratio or (P/B) assign a value 2 and below. If the P / B ratio is 2, means, the price is correct. If the security has P / B less than one, then we are dealing with an undervalued stock. When, when P / B gets a higher ratio 5, we are talking about, that the security is too expensive;
- For the ratio "Price / Sales" or (P/S) we need to set the value 1 and below. It is considered normal, when P / S matters less 2. but, the lower the P / S will be, the less the investor will have to pay for each dollar earned on sales;
- For the ratio "Price / Net Cash Flow" or (Price/Free Cash Flow) the value of the indicator is considered normal below 20. It should be understood here, that the lower the P / FCF will be, the more our business will have free funds, which can be spent on development and on paying dividends to their investors.
If you follow my lead and filter the stock list, setting the minimum values for the above price coefficients, get ready for, that searching in an overheated market may not give you any results. In this case, I can only advise you to switch to options trading and wait, while the situation is back to normal.
Financial ratios
Agree, that our investments should not only be liquid and profitable, but also be distinguished by reliability. In my opinion, reliable securities can be considered those, owned by financially stable companies, whose business is efficient and profitable. For that, to select such companies in your list of shares, I use solvency ratios, liquidity and profitability.
- Debt / Equity Ratio (D / E) should matter below 0,5. The smaller the D / E is the less, the more financially stable the company will be. Personally, I prefer to work with companies, who have no debt. Because the, as Peter Lynch said, a debt-free company will never go bankrupt. This moment is very important for those, who invests in common stock. Indeed, in the event, if the company declares itself bankrupt, they will be at the very rear of the line to receive their assets.
- Urgent liquidity or Quick Ratio must be greater 1. Choosing solvent companies, I always use this limitation, to select only the most liquid assets of enterprises.
- Return on Equity or Return on Equity (ROE) must be assigned a value over 10%. Very important, that the return on investment capital was no less than the return on instruments of low-risk assets. If that's not the case, then I advise you to refuse to trade, but just put your money in the bank at interest.
- Gross Margin or Gross Margin should mean "Positiveand be more 0%.
- Operating Margin or Operating Margin: Positive >0%.
Choosing securities for investment, it is necessary to pay attention to the fact, how regular is the company's business model, in which you are going to invest. That is why it makes sense to carefully study firm reports. For those readers, who still vaguely understand that, what I'm talking about, but they are already taking their first steps, I highly recommend reading my article "Stock Trading for Beginners". You will find a lot of useful information in this overview., which will help you take the first steps in investing, in it you will also find data on the best brokers. If you still have not chosen a company for cooperation, I advise you to pay attention to the broker just2trade. I will tell experienced market participants, that when searching for undervalued stocks, I use filters with minimum margin values or do not use them at all.
Ready-made filter
To use a ready-made filter with all the specified indicators, I suggest youclick on the link. If the filter showed no stocks, play around with the setting and, at your discretion, remove unnecessary indicators, since financial ratios are not so important for speculative trading, it is more needed for long-term investments.

You can safely exploit this wonderful assistant when choosing stocks for your work or for, to set up filtering of the list at your own discretion. You can save the configured site as a screener, which will allow you to save time on Finviz daily setting. Below the table you will see a list of firms, that match your search criteria. The resulting list should be displayed as price chart. This will make you understand faster, what stocks should you pay attention to, and which ones to discard.
Several additional use cases for filters
Imagine the situation, in which we need to find a company, having quite a lot of interest from market participants in the current session. Usually, such companies are those, about which there has been major news recently, prompting traders to actively trade. From a technical point of view, these companies always have inflated trade volumes or price movements.. To find such companies, you can use different filters:
By strong price change
To do this, go to the "Performance"And sort the list by the criterion"Change». After that, we return to the "Charts"And study the charts that appear in it.
Strongly increased trading volume
For this filtering, we need to perform several actions at once.:
- Using the filter already installed in the first example, we also add the filter “Average Volume», to which we set the value “Over 300k». This will allow us to exclude illiquid securities from the search.;
- Go to the tab "Performance"And sort the list by value"Relative Volume», ranking values from highest to lowest. With this parameter, we can estimate, how much the trading volumes in the current session differ from the average indicator;
- We return to the tab already familiar to us from the first example “Charts"And study the charts of companies with the highest trading volumes and money in the current session.
According to finviz news
Since the public and investors are not alien to anything human, they all pay attention to those companies, who had some big news lately. I think, that you and I may well try to sort our list of stocks by news. To find news on the desired securities, you need to go to the section screener to the tab news. In the list under the shares, you will see the latest news by company, we are looking for interesting news, positive or negative, which prompted investors to take active actions in the market. As a result, there is a significant price change, and we get opportunity to earn.
Additionally, we, for example, we can find companies, who have released their financial statements as of today. To carry out such sorting, it is enough to set the filter “Earnings Date"Values"Today Before Market Open». In this way, all companies will be displayed in our list, who published their quarterly or annual reports before the opening of the trading day. Here I want to draw your attention to the fact, that reports on the American market are released exclusively before the beginning of the exchange day or after its end. Besides, reports are released by calendars, and therefore I strongly advise you make a list of companies in advance, which reports you will need.
Official website of finviz.com
At the end of this review, I would like to summarize all of the above about the site. In fact, finviz is great helper Traders, which will allow you to significantly save your time and effort in finding the necessary securities. If you still manually select stocks, you just need to get acquainted with the site. Write in the comments to this post your impressions and feedback from working with finvis. Don't forget to subscribe to blog updates and see you soon!