The information technology sector is the largest Index segment S&P 500, according to market capitalization.
It includes industries:
– Communication equipment
– Electronic equipment and components
– IT-services
– Semiconductors
– Software
– Technological "iron"
Let's look at the valuation of shares of manufacturers of "hardware" and "software". The income generation models of such structures differ, but in general, their analysis obeys general rules. To determine the optimal zones for buying / selling, it is better to use technical analysis.
Income indicators
Locally they are considered in the moment, comparing with analysts' expectations, indicators of other enterprises, median values for the group of comparable enterprises. To determine long-term trends, it is worth evaluating them in dynamics..
General
1) EPS - Net Income Per Share, a key metric for assessing company revenues. The ratio of net income to the number of shares outstanding. When one-time factors appear, you need to consider the adjusted EPS, that is, cleared of one-time income and expenses. Adjusted EPS is traditionally compared to the consensus forecast of analysts.
2) Revenue — revenue, income, sales. It is logical to track it in the context of business segments and geography.
3) ROE - return on equity. Allows you to evaluate the effectiveness of the enterprise. It is the ratio of net income to book value of equity (assets - liabilities). The higher the ROE, the more efficient the business. Attention: higher rates of return on equity may be due to higher debt burden (debt / equity ratio).
4) Margin – profitability of sales – ratio of profit and revenue indicators. The main options for assessing the IT sector are net margin and operating profit margin.
Especially for the sector
1) Volatility. Beta allows you to assess the risks of shares. For most enterprises of the IT sector, the indicator exceeds 2. If the beta is greater 1, then with growth / Fall S&P 500 on 1% stocks are also rising on 1%.
2) Revenue share, generated in Asia, in particular in China. This allows us to assess the regulatory risks from the PRC.
3) Sales of individual products. Examples: Apple's iPhone, memory cards from semiconductor manufacturers.
4) Evaluation of innovative trends and launch of new products. Examples: robotization, artificial intelligence, "cloud", machine education и big data.
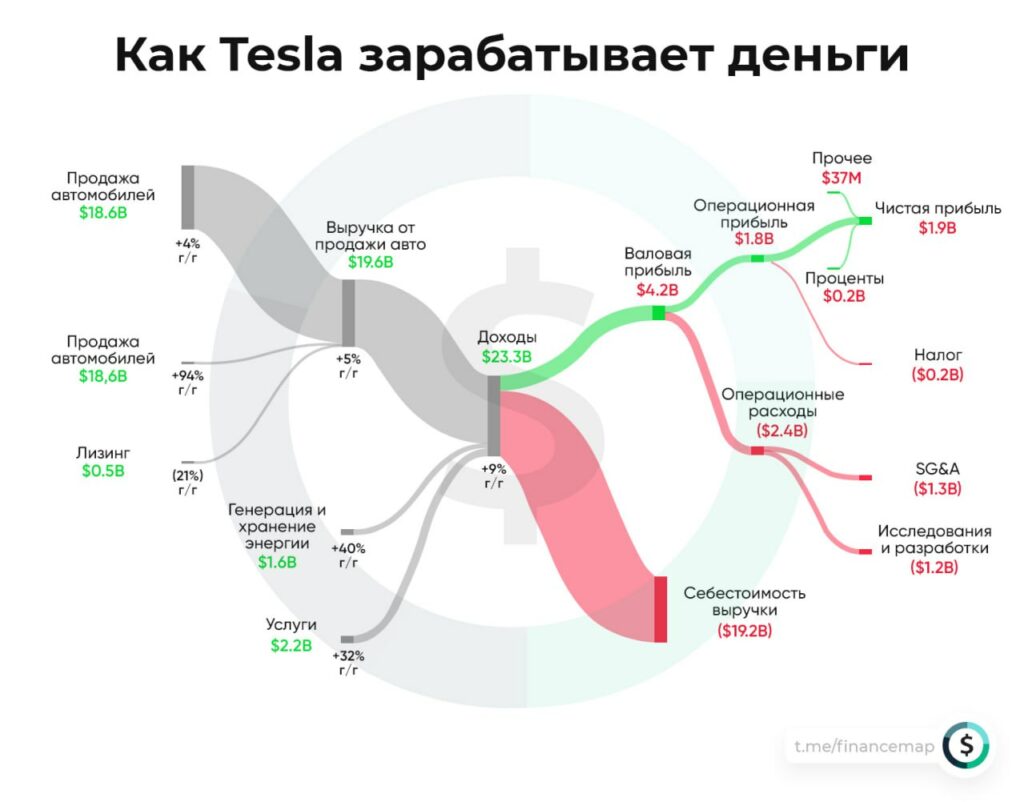
5) Acquisitions and separation of businesses. It can be about buying startups, and the acquisition of fairly large enterprises. About 3 years ago, there were rumors about the possible purchase of Tesla by Apple. Separation example: HP Inc and Hewlett Packard Enterprise.
Dividends and baibeki
IT companies are divided into "growth stories" and "value stories". There are more first in the sector. When they enter the mature stage, they begin to implement programs buyback, later it is possible to start payment of dividends. In "growth stories" they are minimal - no more than 1-1.5 years.
To assess the intensity of buybacks, there is a buyback yield indicator - an analogue of the dividend yield.
"Value stories" may have an increased dividend yield. Example: IBM (5,5% per annum). Stability of payments will allow you to evaluate payout ratio (level of payments from net profit). "Airbag" guarantees payout ratio no more than 70%, debt/equity ratio not more than 80%, high level of "clean cache"
Net Debt = Short-Term Debt (maturity up to a year) + long-term loans (maturity more than a year) – cash
Top 5 stocks with the highest margin of "net cash" falls on the IT sector.
We offer you to get acquainted with the training course «Dividends and buybacks».
Investment appraisal approaches
Classic Cash Flow DiscountIng Model – DCF Model. With its help, a certain conditionally fair price of a share is calculated. Free cash flow is used for this purpose. (FCF), forecast for it taking into account the expected growth rate, discount rate, which is usually taken, based on the CAPM model (takes into account the risk-free rate - the yield on 10-year US government bonds).
A simpler and rougher approach - multiplier estimation. For the IT sector, three multipliers are traditionally used - P/E (price / net profit), P/S (price/ revenue), P/CF (price/cash flow per share). CF is, usually, operational flow.
Forward multiples - adjusted for income or balance sheet expectations. The PEG multiplier is P / E, adjusted for EPS dynamics expectations. Other things being equal, PEG value, equal 1 and below, testifies in favor of buying shares.
If the company's multiples exceed the median values for a group of analogues, then this testifies in favor of the comparative "high cost" of his shares, and vice versa. This is true "ceteris paribus", that is, if the income indicators do not exceed the average values for competitors. Equally too low multiples may not indicate the "cheapness" of shares, and about weak fundamental indicators of the enterprise.
+ technical analysis to determine long-term trends and medium-term zones for entering and exiting positions.
