Technical analysis - forecasting price changes in the future based on the analysis of price changes in the past.
It is based on the analysis of time series of prices - "charts" (from English. chart). Beyond price ranges, technical analysis uses information about trading volumes and other statistical data.
Technical analysis and its traditional opponent fundamental analysis - the main schools of securities analysis. There are differences in the methods of technical analysis in Forex and in the exchange stock market. For example, in the foreign exchange market, transactions are concluded between banks and the volumes of transactions are not published, each bank can publish only its own quotes, transactions take place around the clock, including holidays. On exchanges, prices and volumes of transactions are published by special commissions, trading is carried out within the time of trading sessions. Nevertheless, the general principles of technical analysis are the same in all markets.
Theory
 The beginning of technical analysis was the Japanese candles. The impetus for development was the articles of Charles Doe.
Technical analysis does not consider the reasons for, why the price changes its direction (for example, due to low stock returns, fluctuations in prices for other goods or changes in other conditions), but takes into account only the fact, that the price is already moving in a certain direction.
From an analyst's point of view, income can be generated in any market, if you correctly recognize the trend and open a position in the direction of the trend, and then close the trade position in time. So, if the price has dropped to the bottom, you need to take the opportunity and open a buy position, and if the price rises to the upper limit and reverses, open a sell position. It is also possible to take into account the volume of trades.
In addition to trends, technical analysis examines and analyzes the so-called patterns. - typical drawings, "Figures", forming on charts. The most famous are the "Double Top", "Head and shoulders", "Flag". A wide variety of different triangles. They will be discussed separately below..
conclusions, obtained on the basis of technical analysis, may disagree with conclusions, derived from fundamental analysis. Mostly, fundamental analysis is based on the fact, what is the real value of the goods (security, currency pair) differs from the market price - it is overvalued or underestimated. If you can calculate the "correct" price, then we can assume, that the market will "correct" to the desired level (correction can be up or down). Therefore, the recommendations of fundamental analysis may contradict the recommendations of technical analysis..
It should be noted, that both methods do not take into account possible market distortion by insider information users.
Axioms of technical analysis
- Market price movements take into account all information. According to this axiom, all information, affecting the price of goods, is already taken into account in the price itself and the volume of trading and there is no need to separately study the dependence of the price on political, economic and other factors. It is enough to focus on studying price / volume dynamics and get information about the most likely market development.
- Price movement is subject to trends. Prices don't just change randomly, while following some trends (trends), that is, the time series of prices can be divided into intervals, in which price changes prevail in certain directions.
- History Repeats Itself. It makes sense to use graphical models of price changes, developed on the basis of historical data analysis, since price changes reflect a fairly stable psychology of the market crowd - participants react to similar situations in a similar way. But the nature of the movement is also repeated. Known, that the price in many cases rises relatively smoothly, but it falls in jumps
- Technical analysis doesn't work
Despite, what many technical analysts believe, that their technique gives them an edge over other bidders, not all researchers share this belief. Technical analysis of price charts in the past does not allow predicting the "pivot points" of prices in the future, and when prices are developing in an already known direction, technical analysis gives the simplest buy and hold strategy.
There are many successful investors among the critics of technical analysis..
Warren Buffett says the following: "I understood, that technical analysis doesn't work, when turned over charts prices "upside down" and got the same result".
Peter Lynch: “The price charts are great, to predict the past ".
Technical analysis works
To recognize a trend, you need technical analysis tools. Technical analysis helps to do this., although he does not give an accurate forecast.
Critics, spoken to technical analysis, relies on attempts to precisely predict price movements, at the time, how the true task of technical analysis tools is to adequately assess the picture of what is happening on the market at the current moment, therefore statements that, that technical analysis doesn't work, not entirely justified.
If we are to compare a technical analyst, and analytics, based only on fundamental analysis, then both are in the same vulnerable position. Despite all the criticism, the use of technical analysis precisely as an additional tool, still remains an indispensable method for choosing the point of opening a position.
Application of technical analysis and main indicators
Technical analysis is actively used in online trading today..
Often, bidders make the following mistake: they consider indicators to be the primary source of information, because in books on technical analysis they are presented as something, what the future predicts. Comparing the formulas for calculating indicators of price changes and the formulas for calculating the speed and acceleration of movement in ordinary school physics, can see, that some of the indicators show the first and second derivatives of the price, i.e. speed and acceleration. With their help, you can study the price chart and trends., but they cannot accurately predict the entire course of the graph: it would mean, that cause and effect have reversed.
Misconceptions about indicators can lead to errors: for example, Momentum and Stochastics are useful in a slow market, when the price rises smoothly and then stops growing, but in a rapidly changing market, these indicators can give false signals and confuse the trader.
The main primary indicators are price and trading volume., as well as supply and demand. Primary sources of information can change independently of each other. Actually, they determine the number of degrees of freedom of an exchange position (i.e, any point on the chart looks like “the volume of transactions, price, supply and demand", for example, in coordinates "X, Y, WITH"). From this point of view, the chart does not fluctuate only up and down - it has more possible states.
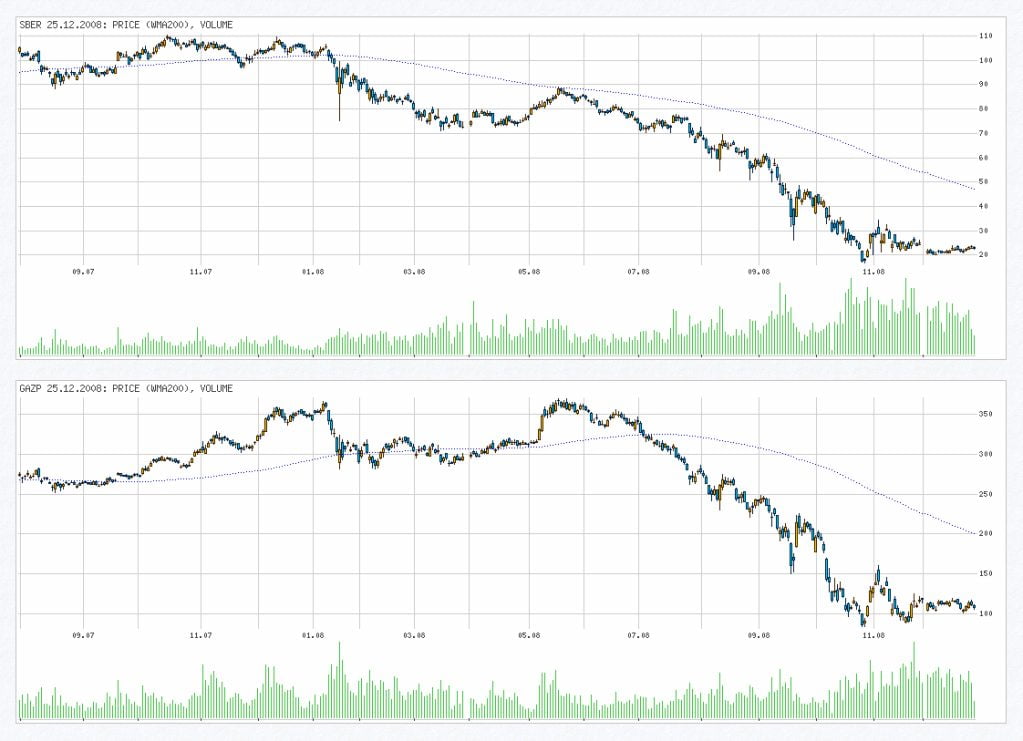
Attempts to recognize the direction of the market trend are made on the basis of primary sources of information and independent indicators.. For example, a technical analyst can make the following assumption: “The graph shows, that the price rise has stopped, but the volume of transactions increased sharply, and supply and demand show, that the holders of large blocks of shares are selling them - therefore, it's time to close long positions, the sale starts " (such reasoning can be given in relation to the BSE chart in the figure above). The general rule looks like this: supply and demand set the price and it is confirmed by the volume.
More than one hundred and fifty technical indicators are known in total. Let's consider the most basic:
Trading volume - shows the liquidity of the instrument.
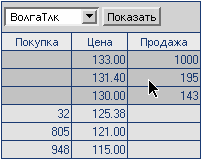
Trading glass - table of orders for the purchase and sale of securities on the stock market.
trend - the direction of the predominant movement of indicators.
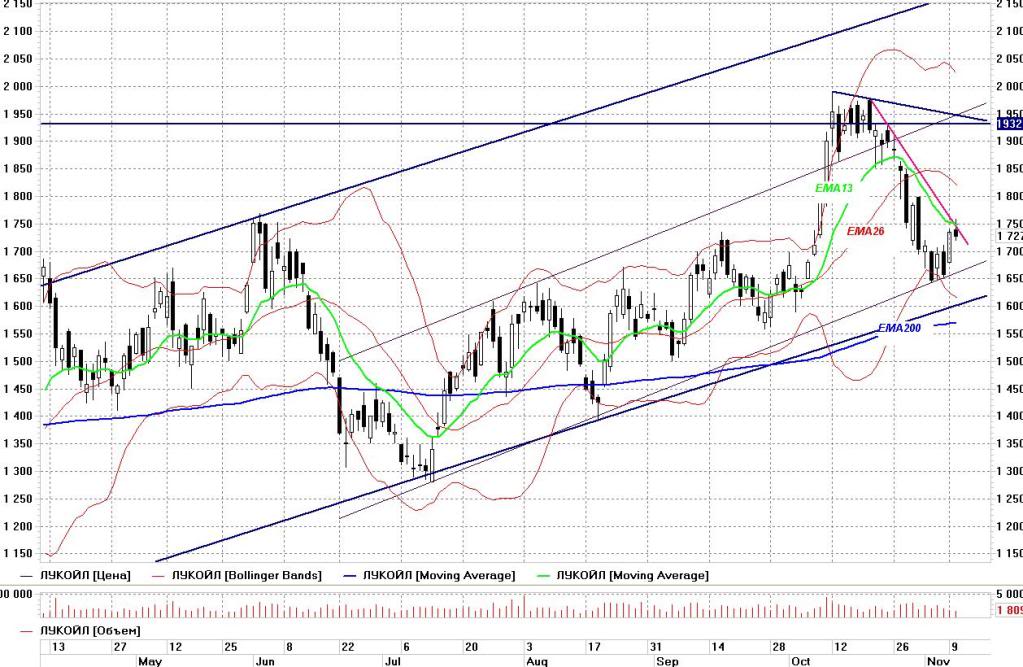
moving average (MA – Moving Average)
инструмент сглаживания временных рядов. Its purpose is, to determine the start time of a new trend or to confirm the existence of the current. Warn about its end or turn. Actually, using moving averages, we monitor the trend: while she, suspecting nothing, develops, we are watching her. In a manner, moving averages – trend satellites. By its nature, MA is at least a little, but lags behind market dynamics. In the same time, well then, that the short-term MA more accurately conveys the price movement, the longer.
Simple moving average is defined as the average closing price over the last N days (or other periods - minutes, 5-minutes, 15-minutes, hour periods and the like), ending with the current day. For example, 200-the daily moving average will be equal to the average of the last 200 closings.
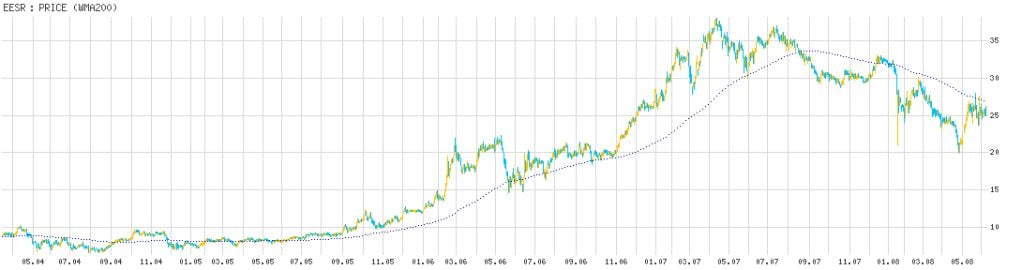
Weighted Moving Average gives more weight to recent values and less weight to early values..
Usually, moving averages are calculated based on closing prices. Nevertheless, you can calculate the moving averages of the opening prices, highs, lows, as well as average daily prices.
MACD indicator
(Moving Average Convergence/Divergence – moving averages convergence / divergence) - the indicator is used to check the strength and direction of the trend, as well as defining pivot points.
Usually, the signal "Buy" is considered, when the moving one with a shorter period (the picture shows a blue line) in the lower zone, it crosses the MA with a large period from bottom to top (red line). The signal "Sell" is considered, when the moving average with a smaller period in the upper zone crosses the moving average with a large period from top to bottom. The larger timeframe, the fewer false signals there will be (in the figure below, false moments are shown by circles). Weekly and daily charts give good results., to a lesser extent - sentries. On small time frames, relative price volatility is higher.
If always "Buy", when the moving average of a shorter period crosses the average from the bottom up and "Sell", when she crosses from top to bottom, then the results may be bad: after crossing the moving average of a shorter period, its average from the bottom up often rolls back in the opposite direction, leading to a loss in a position open for this intersection (see picture: in the price chart window, after the rate fell from point "C" to "B", it rolled back to point "D", and then the price reversed and went down to point "E"; in the MACD window - the indicator follows the price chart, but, as soon as the moving average of a shorter period (blue line) from point "B" turned around and crossed the average of the large period (red line) fan bottom, the blue line then turned around from point "D" and went down).
The usual approach to addressing the shortcomings of any indicator is to add additional indicators: ADX, RSI, Stochastic and others.
Relative Strength Index RSI - indicator, determining the strength of the trend and the likelihood of its change.
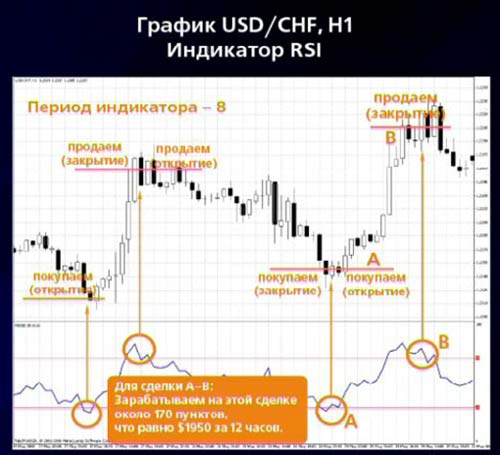
Overbought / oversold - when the value of the RSI indicator is closer to the mark 100% or “0%, respectively.
Divergence - when the indicator chart forms extremes in the direction, reverse direction of price movement.
Technical analysis patterns are applicable to the RSI indicator chart and can predict the end of the trend. About the figures a little below.
The trend on the indicator usually coincides with the trend on the price chart up to any of the above events.
Stochastic indicator (stochastic oscillator)
indicator, which shows the position of the current price relative to the price range for a certain period in the past. Measured as a percentage.
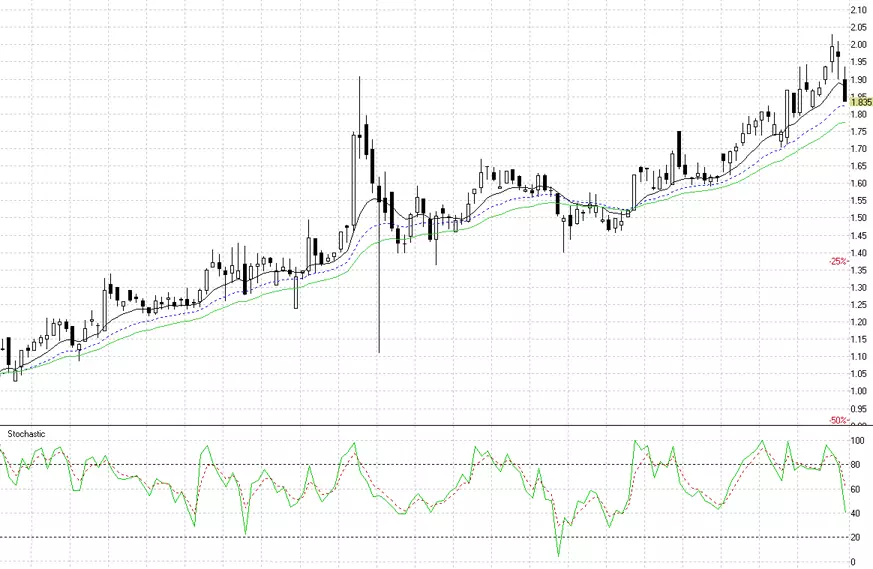
- %K - fast stochastic (solid line, main schedule)
- %D - slow stochastic (dotted line, additionally averaged graph)
Buy, when the indicator chart line (%K or% D) first drops below a specified level (usually 20 %), and then rise above him. Sell, when the indicator chart line first rises above a certain level (usually 80 %), and then falls below him.
Buy, if the% K line rises above the% D line. Sell, if the% K line falls below the% D line.
Identify discrepancies, for example, when prices form a series of new highs, and the stochastic indicator fails to rise above its previous highs, we can expect the beginning of a trend for a fall in prices, that is, you can sell.
Crossing elevation 80 % when the indicator grows, it is interpreted, as a signal of a probable stop of growth or even the beginning of a decline in prices. Crossing elevation 20 % when the indicator goes down, it is interpreted, as a signal of a probable stop of a fall or even the beginning of a rise in prices.
Shapes
Head and shoulders (reversal pattern).
Double bottom (reversal pattern)
Double peak (reversal pattern)
Mug (trend continuation pattern)
Bearish measured move (fall figure)
Bullish measured move (growth figure)
Rounded bottom, saucer (growth figure)
falling wedge (reversal pattern)
Triple peak (reversal pattern)
Isosceles triangle (continuation figure)
Ascending triangle (bullish figure)
Descending triangle (bear figure)
Triple bottom (reversal pattern)
Rectangle (trend continuation pattern)
Canyon (growth figure)
rising wedge (reversal pattern)
Some figures are long-term, and many are worth studying in more detail, not only how they look.
Введение в мир технического анализа
Технический анализ — это инструментальная основа трейдера, позволяющая судить о динамике финансовых рынков и формировать обоснованные торговые решения. Он опирается на анализ графиков цен и объемов торгов, что помогает прогнозировать будущие тенденции рынка.
Основные принципы технического анализа: психология рынка и поведенческие модели
Технический анализ учитывает поведенческие аспекты рынка, отражающие все известные и предполагаемые факторы, влияющие на стоимость активов. Тенденции и тренды играют ключевую роль в прогнозировании будущих цен, а объемы торгов служат индикатором интереса участников рынка к определенному активу.
Инструменты и методы технического анализа
Технический анализ включает широкий спектр инструментов, в том числе графический анализ с использованием свечных и барных моделей, линейных графиков, а также различные технические индикаторы и осцилляторы, for example, moving averages, индикаторы импульса и объемные индикаторы.
Стратегические подходы в техническом анализе
Эффективность технического анализа повышается при использовании стратегий, основанных на прорыве уровней поддержки и сопротивления, применении технических индикаторов для определения оптимальных точек входа и выхода, а также управлении рисками и позициями.
Практическое применение технического анализа в торговле
Практика технического анализа требует разработки торгового плана и возможности его автоматизации с помощью специализированного ПО. Ключевым элементом является также ретроспективный анализ, который помогает извлекать уроки из прошлых торговых сессий.
Особенности технического анализа на разных рынках
Технический анализ применим к различным финансовым рынкам, включая рынки акций, bonds, валют и криптовалют. Каждый из рынков имеет свои уникальные характеристики и требует индивидуального подхода к анализу.
Анализ конкретных торговых сессий и стратегий
Изучение конкретных торговых сессий и успешно реализованных стратегий дает практические примеры использования технического анализа, позволяя трейдерам учиться на чужом опыте и минимизировать собственные ошибки.
Ответы на вопросы по техническому анализу
В статье освещаются ответы на часто задаваемые вопросы, касающиеся различий между техническим и фундаментальным анализом, определения наиболее эффективных инструментов технического анализа и возможности полной зависимости от технического анализа в торговле.
Заключительные мысли о техническом анализе
В заключительной части подчеркивается значимость постоянного обучения и адаптации к новым технологиям в техническом анализе, что позволяет трейдерам успешно справляться с изменениями на рынке.
Appendix: инструменты для глубокого погружения в технический анализ
В дополнение к основному тексту представлены ресурсы для дальнейшего изучения технического анализа, including vocabulary terms, рекомендуемую литературу и информацию об онлайн-курсах и семинарах.