Union Pacific (NYSE: UNP) - the most valuable company in the North American rail sector with a century and a half history of development. The holding's current market capitalization exceeds $ 140 billion.
About company
Union Pacific is one of the world's leading transport companies, which is engaged in railway transportation. The business of a railway operator can be divided into three groups..
Union Pacific Revenue Structure
| Wholesale transportation | 33% |
| Transportation of industrial products | 36% |
| Transportation of premium products | 31% |
33%
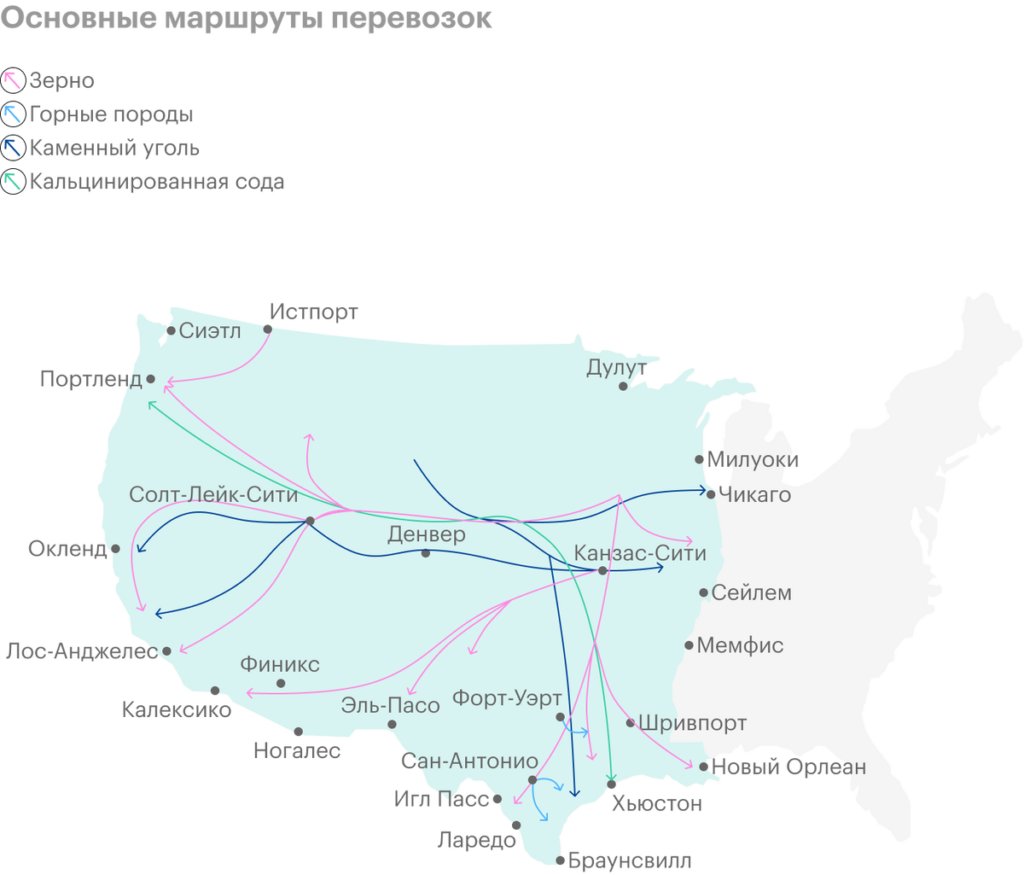
Wholesale transportation. The segment supplies grain and grain products, fertilizers, food and chilled goods, and coal and renewable energy products, mainly export of biomass and components of wind turbines.
Revenue structure of the segment "Wholesale transportation"
| Coal and products for RES | 41% |
| Grain and cereals | 39% |
| Food & Chilled Foods | 10% |
| Fertilizers | 10% |
41%
Transportation of industrial products. This business transports industrial chemicals, plastic, metals, minerals, forest products, energy carriers: oil, gas.
Revenue structure of the segment "Transportation of industrial products"
| Metals and minerals | 32% |
| Chemicals & Plastics | 30% |
| Energy carriers | 27% |
| Forest products | 11% |
32%
Transportation of premium products. The segment transports finished cars and automotive parts, as well as goods in intermodal containers, as internal, as well as international.
Revenue structure of the segment "Transportation of premium products"
| Intermodal containers | 82% |
| Automotive products | 18% |
82%
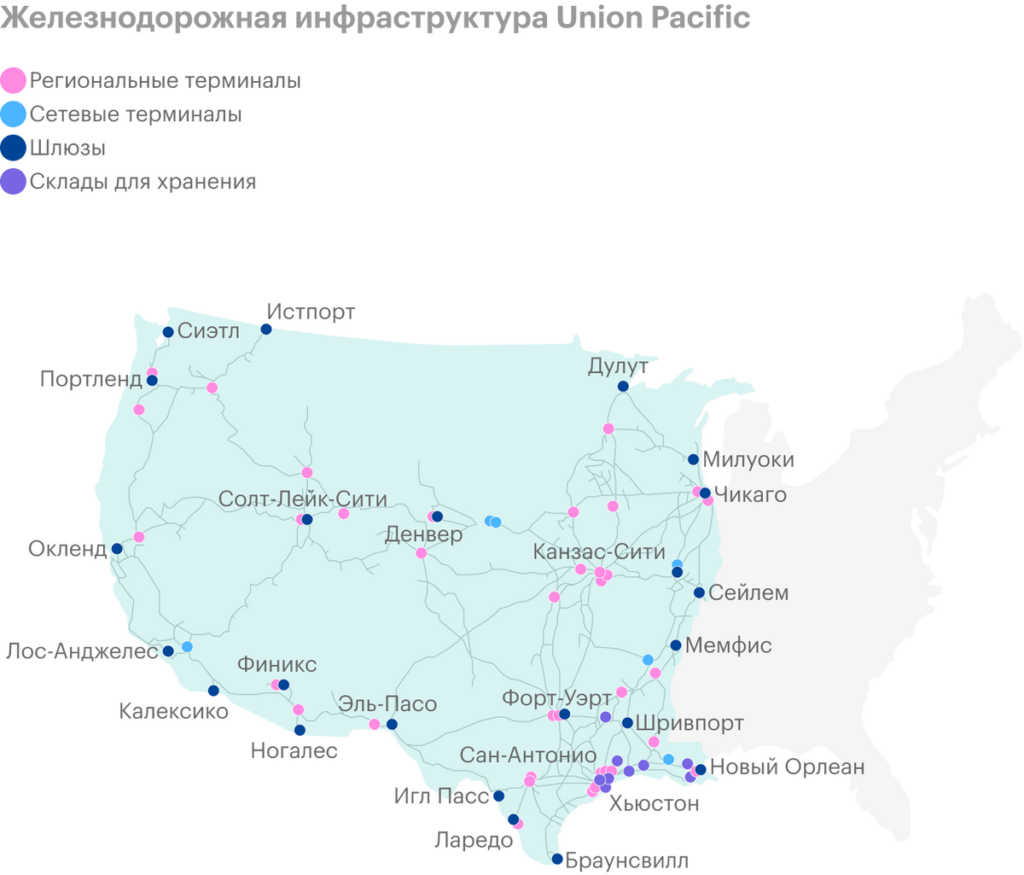
Union Pacific Rail Assets
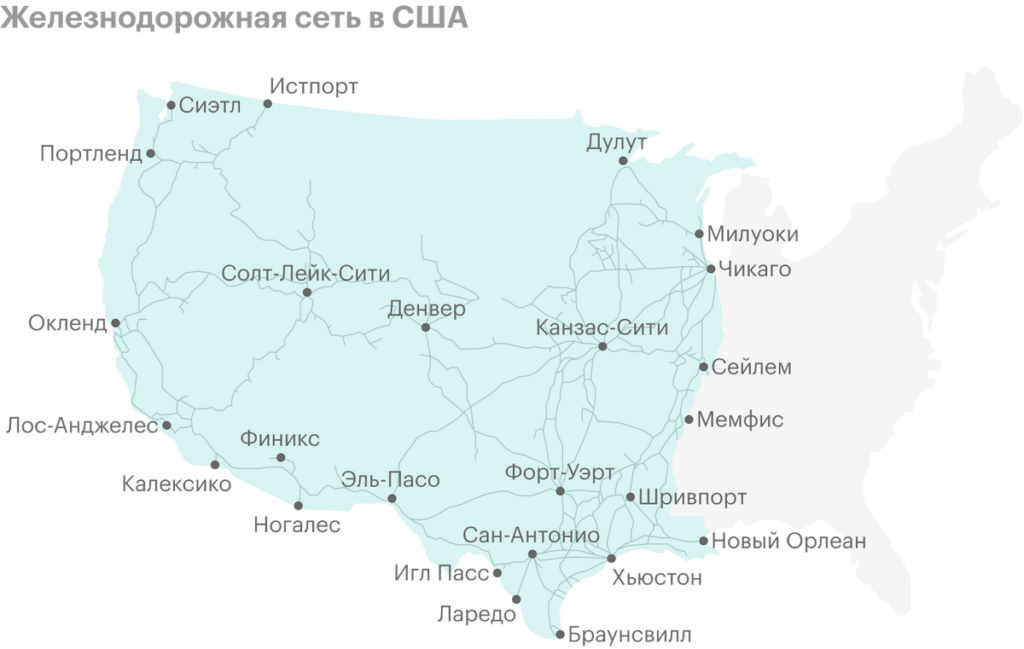
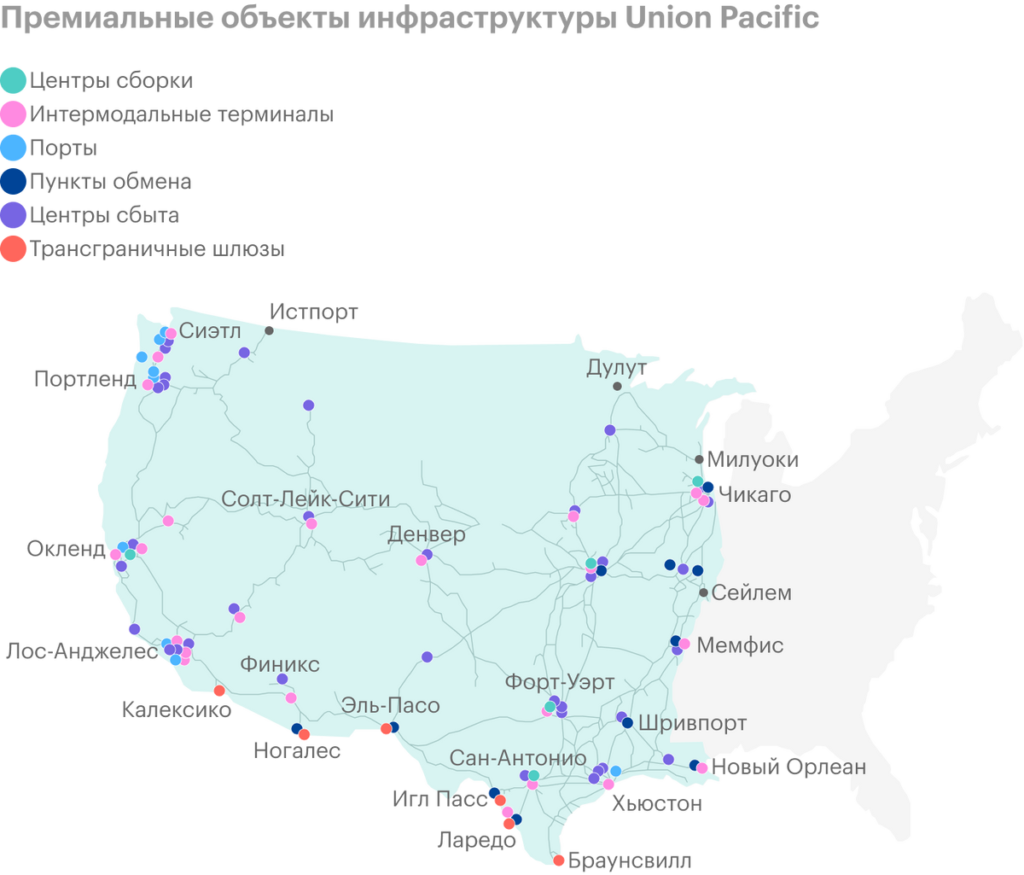
As of December 31, 2020, Union Pacific's rail network is more than 32,000 miles and connects pacific coast and Gulf Coast ports with the U.S. Midwest and East., and also ensures the movement of goods on key routes of Mexico.
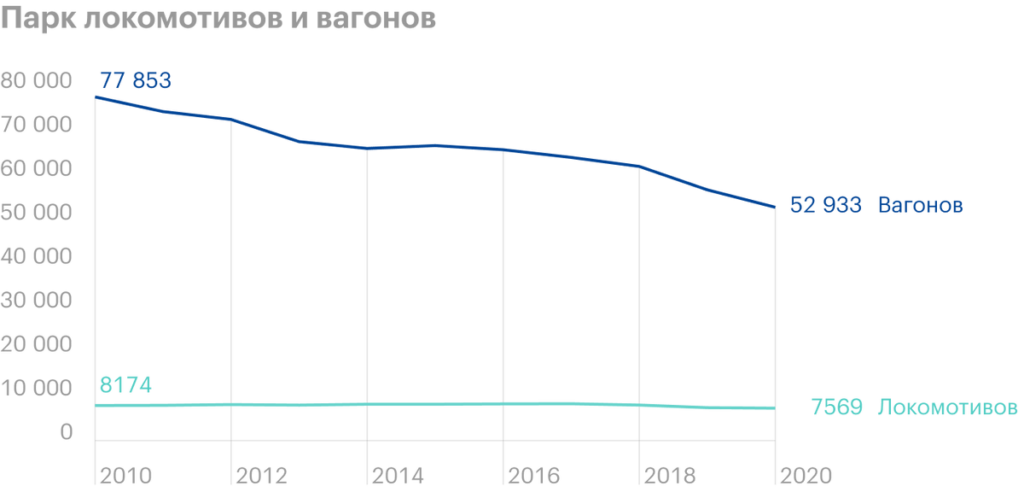
After the railway network, the company's second most important asset is its fleet of locomotives and wagons, one of the largest in the United States. The median age of Union Pacific is 27 years versus 26 years for Norfolk Southern and 21 years for CSX..
Development strategy and goals
Union Pacific's strategy is, to ensure safety, reliability, efficiency and the best service for its customers. All this, in the opinion of management, will help the company remain the best rail operator in North America and lay the foundation for future growth in financial results.
Union Pacific's short-term forecast for 2021:
- Keeping capital costs lower 15% of annual revenue.
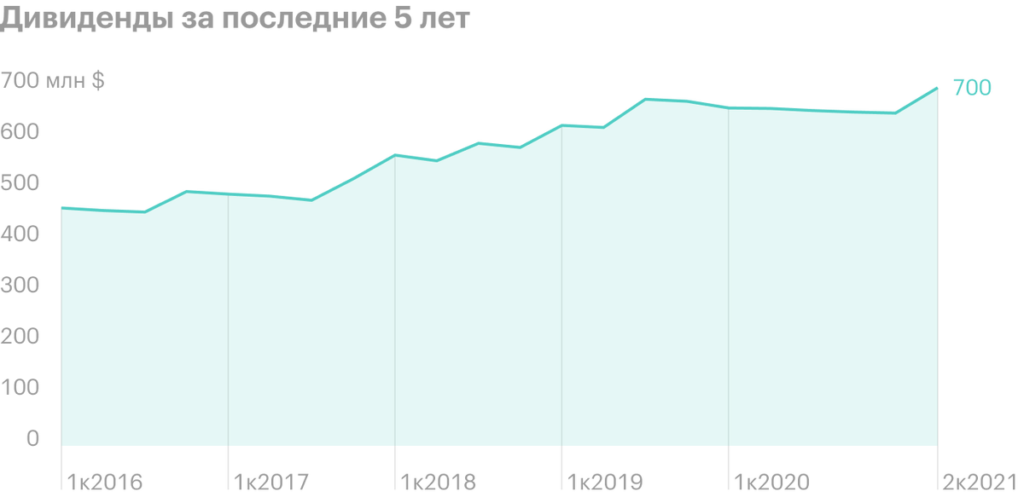
- The target dividend payout ratio is approximately 45% from profit.
- Annual traffic volume will increase by 7%.
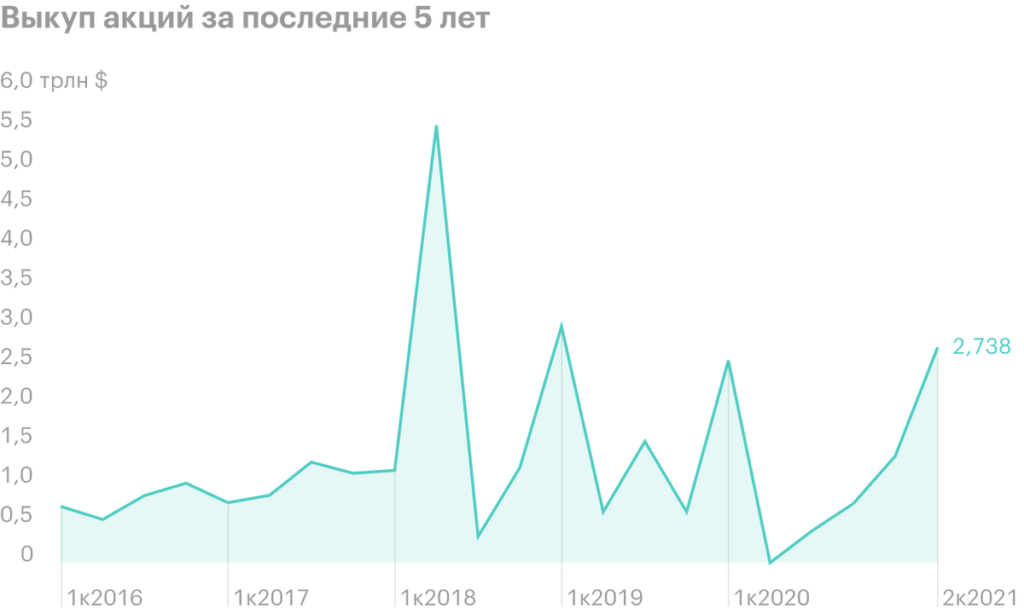
- Strong free cash flow generation, which will contribute to greater share buybacks.
- The company plans to buy back its own shares in the amount of $ 7 billion.
Main medium-term goals of the plan for 2022-2024:
- Growth of ROIC indicator from current values in 15 to 17%.
- Keeping capital costs down 15% of annual revenue.
- For three years, the company plans to buy back its own shares in the amount of 18-19 billion dollars..
- The profit distribution ratio for dividends will be 45%.
Profit distribution
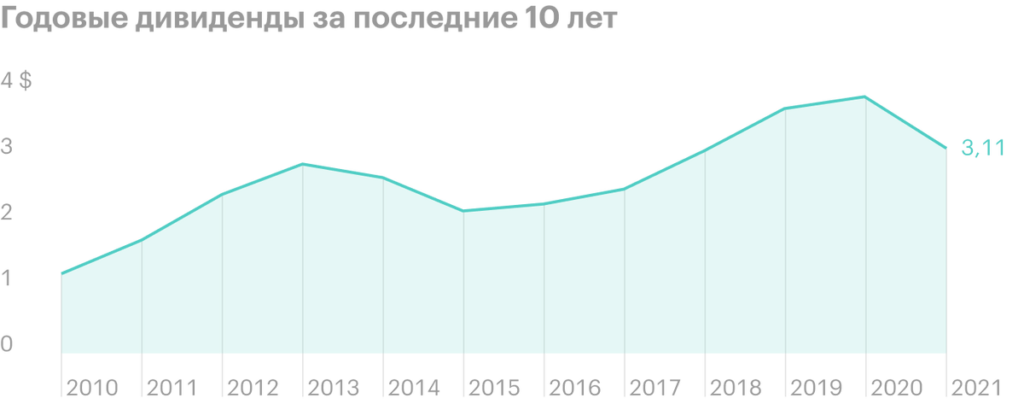
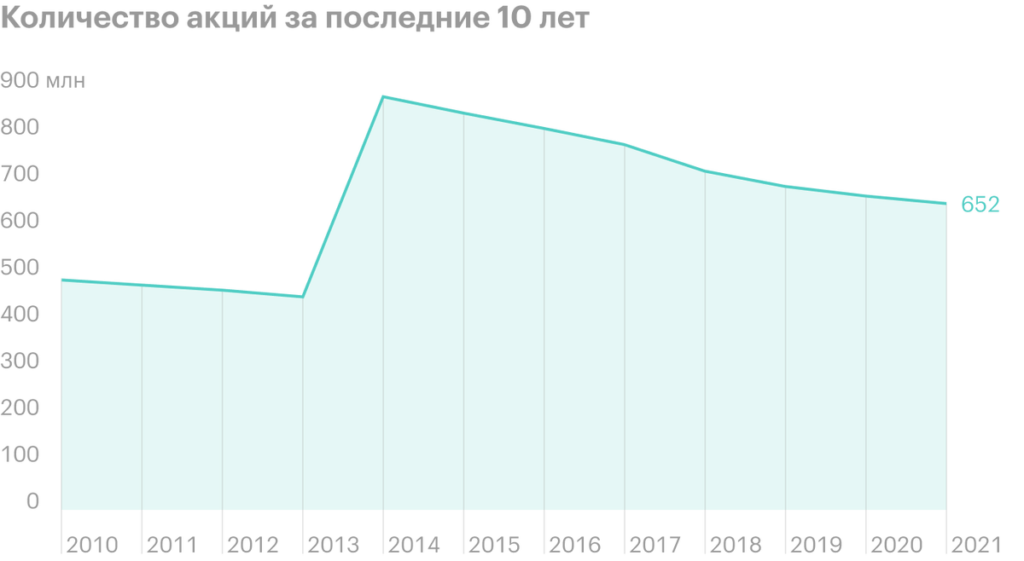
Like the rest of the railway sector, Union Pacific pursues a rather aggressive policy in terms of profit distribution, paying dividends and by making buybacks. The company's annual dividend has been growing for more than 10 years, in 2015, the actual payment also increased, because on June 6, 2014, the railway operator held split shares in the ratio 2 to 1.
Financial results
Union Pacific's sustainable business model allows the company to demonstrate stable financial performance. The only exception is 2017, when the railroad operator recorded a one-time profit of $5.9 billion in Q4 due to Trump's tax reform.
Financial results for the last 5 years, billion dollars
| Revenue | EBITDA | Net profit | net debt | |
|---|---|---|---|---|
| 2016 | 19,941 | 9,502 | 4,233 | 13,730 |
| 2017 | 21,240 | 10,456 | 10,712 | 15,669 |
| 2018 | 22,832 | 10,802 | 5,966 | 21,118 |
| 2019 | 21,708 | 11,013 | 5,919 | 24,369 |
| 2020 | 19,533 | 10,331 | 5,349 | 24,930 |
| 6м2021 | 10,505 | 5,565 | 3,139 | 27,697 |
Comparison with competitors
| EV / EBITDA | P / E | Net Debt / EBITDA | |
|---|---|---|---|
| Union Pacific | 15,59 | 23,68 | 2,59 |
| CSX | 12,94 | 21,1 | 2,04 |
| Kansas City Southern | 20,6 | 37,58 | 2,4 |
| Norfolk Southern | 14,27 | 22,62 | 2,33 |
Arguments for
Sector Leader. Union Pacific is the largest rail operator in the United States..
High level of profit sharing. In H1 2021, the company returned $5.435 billion to shareholders through dividends and buyback. Taking into account the fact that the current capitalization of Union Pacific is equal to $ 140 billion, profitability for the 1st half of the year was 3,9% - against 3,3% Norfolk Southern and 2,2% at CSX.
Moderate debt burden. The company's net debt is $27.697 billion., and the multiplier "net debt" / EBITDA »equal 2,59.
Top 100. Union Pacific is among the first hundred companies in the world by capitalization.
Arguments against
Older fleet of locomotives and wagons, the average age of Union Pacific is 27 years, - vs. 26 years for Norfolk Southern and 21 years for CSX.
Evaluation. Union Pacific has higher multiples compared to its competitors.
What's the bottom line?
Union Pacific is the largest player in the U.S. rail sector.. The company is financially stable, which allows it to return through dividends and buyback almost all earned net profit to shareholders.
To the end 2024 The railway operator plans to return $ 25-26 billion through a buyback in addition to dividends, which now bring annually 2% profitability.
