Who is the trader?? The Ultimate Guide
Understanding a Trader Definition of a Trader Trader – it is an individual or a company, which buys and sells financial instruments. It can be promotions, bonds, goods, currencies or other types of derivatives.
Understanding a Trader Definition of a Trader Trader – it is an individual or a company, which buys and sells financial instruments. It can be promotions, bonds, goods, currencies or other types of derivatives.
2017 the year was marked by exponential growth of the cryptocurrency market, whose dynamics amaze the imagination. Many in the past year were once again convinced that, that the profitability of investments in new assets is often more attractive than the results of investing in shares of even the most successful companies. The prospects for obtaining significant profit on invested funds attract more and more new participants to the cryptocurrency market, including famous players in the world of traditional finance.
www.tradingview.com – viewing charts online through a browser
Technical analysis – forecasting price changes in the future based on the analysis of price changes in the past.It is based on the analysis of time
This topic, in principle, is rarely discussed., meanwhile, I consider the habit of trashing profits to be one of the components of success. The trawl does not have to be mechanical. Profit can be trashed mentally. You can trust your intuition, you can transfer periodically protective stops. I used to trade like this: opened a position, проанализировав график, noting support / resistance levels, by drawing channels, pulling the Fibo mesh, мог […]
Someone loves portfolios, someone prefers to change trading instruments, а я считаю, which is better to trade one instrument. This is especially true for intraday trading.. Every currency, each cross or futures behaves differently and, watching them in the terminal, we notice certain persistent behaviors for sessions over time, or for corrections, we can assume the strength of the movement on the news […]
And this is the secret SP500 scientific and technical analysis from the TradingCentral laboratory.:
Our pivot point located upon 1130.
Our preferences: till 1130 not overcome up, we prefer the direction down to 1040 and then the next target 1020.
Alternative scenario: only overcoming 1130 will invalidate a bearish scenario. In this case, the price should first recover to 1164 и потом до 1200.
A comment: daily indicators turned down and call to test the zone 1020.
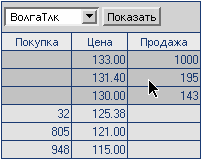
Поддержки и Сопротивления:
1200 **
1164 **
1130 **
1103 last
1040 **
1020 **
978 **
Steve Neeson, President of Nison Research International, Inc. (NRI), was the first, who discovered the Japanese method of technical analysis, known as "candlestick charts", for the West. He is an internationally recognized authority in the field., revolutionized technical analysis in the USA and Europe by applying these methods. He is the author of two popular books.: "Japanese Candlesticks" and "Beyond Japanese Candlesticks". He advises all over the world, including the Federal Reserve and World Bank. At NRI, Mr. Neeson specializes in webinars and consulting services to organizations. Detecting Early Reversal Signals With Japanese Candlesticks A prudent person has more than one bowstring for his bow.. ( Japanese proverb) Analysis of Japanese candlestick charts has this name, because its lines resemble candles. Used by generations of people in East Asia. Such graphs were in use long before columnar histograms or "tic-tac-toe", but were practically unknown to the Western world before, how I introduced them into use in 1990 year. This charting technique is now used internationally by many traders., investors and well-known financial institutions.
Earlier, I already wrote about a part of that trader's toolkit., which I myself use in my trade (cm. статью «Инструментарий«)
Since my main specialization is precisely the graphical analysis of Japanese candlesticks on Forex, futures. promotions, in this post I will try to reveal this topic in more detail.
so, I use stock charts to analyze market situations and predict prices. If speech […]
