ASDF
Need to learn the rules of the game. And then, start playing better than anyone (with) BUT. EinsteinFor 4 years, I apparently have not yet learned all the rules .. IF TODAY IN SIS…
Need to learn the rules of the game. And then, start playing better than anyone (with) BUT. EinsteinFor 4 years, I apparently have not yet learned all the rules .. IF TODAY IN SIS…
The daily SPX chart has formed the right shoulder, which can be characterized as EVENING STAR .
According to the theoretical research of Bulkovsky
Theoretical performance: Bearish reversal
Tested performance: Bearish reversal 72% of the time
Frequency rank: 71
Overall performance rank: 4
Best percentage meeting price target: 50% (bull market, up breakout)
Best average move in 10 days: 8.77% (bear market, up breakout)
Best 10-day performance rank: 4 (bear market, up breakout)
All ranks are out of 103 candlestick patterns with the top performer ranking 1. "Best" means the highest rated of the four combinations of bull/bear market, up/down breakouts
Double Top in Eurodollar, the pound can also fall out of the channel and then the zone is likely 1.57. Not everything is so simple in gold yet, but an interesting pattern can be realized .
UPD. A futures S&P overstrained, although many thought, what goes up next, yes and me, despite the bearish sentiment, began to doubt.
… haven't been so bearish about markets in a while. Why?
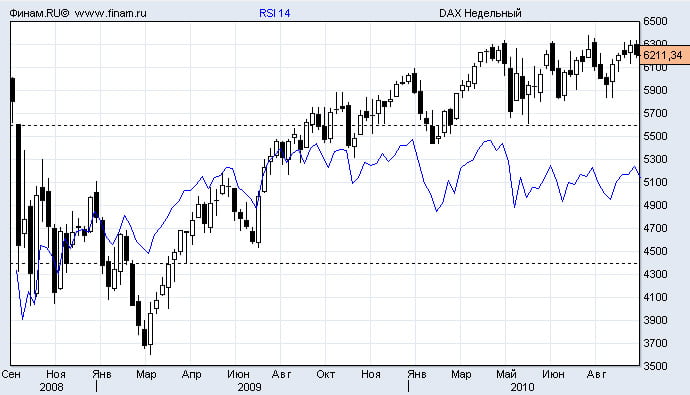
It is sometimes helpful to look a little further than your own nose., therefore, we will build on weekly charts.
Немного слов, quite enough pictures.
Let's start with Europe.

Loved by many DAX. Trades in a rather narrow range, from which it cannot get out in any way. After “hanged man” на прошлой неделе, a bearish engulfing candlestick formed on this one. You will have to try very hard to neutralize the negative..

France. Almost a carbon copy of the Germans, with one “but” Clearly visible “inverted flag”, pattern implementation, may well lead us to the level 3000.

English Footsie 100. Looks a little better. Traded at the resistance, the goal for the hike up is limited. A candlestick pattern has formed “doji”, what is hinting.
The americans.

After explosive growth and it would seem, Inverted GiPa resistance breakdown, hesitant trampling. As a result – “doji”.
Commodities and emerging markets.

Australia. Breaking through the neck line of an inverted GiP, the price was unable to gain a foothold above.

On the day, the negative is seen more clearly. To overcome it, a powerful upward movement is needed in the coming days. Otherwise “ouch”.

Indian market, breaking through the ascending channel, grew steadily within a month, reaching the target zone. As a result, we have a certain similarity “hanged man”. What happens with such RSI values on weekly charts, no need to speak. Correction, possibly to the area 1850.

Brazil looks confident. The price is moving in an upward channel, but on closer examination, we see all the same “inverted flag” and the proximity of a powerful zone of resistance. Nevertheless, growth next week is quite possible here.
I did not give a picture for China – everything is very narrow and vague there, in my opinion. Now back to our rams.

MICEX. The index grows sluggishly within the limits “inverted pennant” Exit in such cases, usually going down, plus formed “hanged”. Divergence by RSI. To improve the situation, a powerful upward throw is required, with fastening. Sberbank alone is clearly not enough for this..

Sber. Arranged for all shorts “Kuzkin's mother” this week. However, the upward movement on it is limited by powerful resistance., and pattern boundaries (again this inverted flag). The only thing, what can make me throw my shorts over it, this is consolidation above the highs of the year.

The monthly chart shows, that the exit can take place as a retest of the absolute maximums, and correction for 65-70, а может и 40, Who knows. Я сильно сомневаюсь, that with a general correction, Sberbank will go higher. That's why, so as not to call RBC with a question:”I bought Sberbank for 90 р., so what's now?!”, I would refrain from shopping now, pending clarification, so to speak :)
I will not write about Gold, there the correction is not just ripe… :) For Eurodollar View here

Oil (Brent). Powerfully shot up, closing above resistance. Seems, from the campaign of 90 nothing holds us back. Only a virtual obstacle remains, as a channel boundary. В Россию, Consequently, send money,(Really, nobody buys something in the oil industry, why, interesting?). Think, next week will clarify a lot.
Another system for American stocks. Long only. Exploits a rare pattern. But there is one peculiarity — since there are very few transactions, about 50 in year, then it can only be used as an addition to other systems, so that money does not stand idle. It is clear from everything that the system must be stable. — recovery factor and profit factor are rather big, and especially the average profit per trade 4,67%.
Do not be confused by the annual percentage of profit. It's just that the start-up capital was chosen large to capture all the trades.. If you reduce it, for example, to 20000, then the percentage will increase accordingly in 5 once..
Some suggest, what if we take opposite input signals from losers or people, unaware of the market, then a successful reverse model can be built. Sounds , certainly, attractively!!!
but, if you are successful, why do you need this model, and if not successful, then apply reversibility to your trade.
to me , indirectly, I had to observe this approach in the company, who wanted to apply such an algorithm, but the result was negative.
The problem is, that it is impossible to turn on the algorithm at the right time, when losers all merge together at the same time. Every loser can produce after 10-20 consecutive negative trades, 10-20 consecutive positive trades. Even if you collect such losers and study them in the same market and study their behavioral pattern, trying to filter them by standard deviations and trying to include them when they already did 10-20 positive and expecting, that now they will start draining, then you can again get into a non-standard position and drain a lot of money. Besides, this mass of losers is still self-taught and even Lukeria will not repeat the same mistake and therefore not a reverse system will turn out, a random system.
In other words, не так уж просто, as it seems at first glance. Too many variables, which are not easy to formalize, including the psychological factor, despite the seeming possibilities of automation.
Technical analysis again " didn't work" And ,certainly, breaking zone 2-5 July, which I spoke about long ago, too " didn't work ''.
AND , certainly, there are those, who's to say " well, you yourself made money on this?".
Firstly, in terms of technical analytics ,this is one aspect.
As for trading, this is another aspect.
Yes, I bought in the zone 2-5 July, did much- No, but did enough. Underestimated the power of the rebound -YES.
Thought, that somebody will notice this technical formation, which I mentioned earlier. They, who have been following my notes for a long time must say for sure. Besides, the formation itself has a clear bias.
I will quote again, I hope they will answer me what I call the pattern, highlighted in black lines
When I hear about double dip forecasts or another type of BP, then I start to remember something from physics.
Previously, I often met, that after big falls or strong growth in the market, the principle of damped fluctuations works, when the system stabilizes, but does not fall or grow to extreme for a long time. The same principle of earthquakes, after a powerful push, there is a series of small ones and gradually fades.
The same principle works in most cases in financial markets..
As a matter of fact, my forecast for many assets was built , based on this principle.