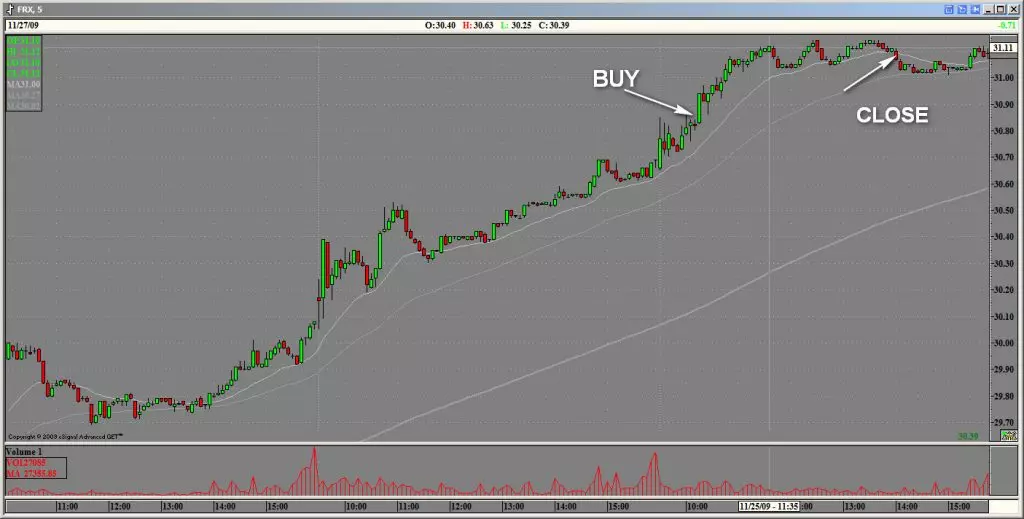
FRX : Forest Laboratories Sector: Healthcare > Industry: Biotechnology and Drugs Trend Continuation Buy. TPC : Tutor Perini Corporation Sector: Capital Goods > Industry: Construction Services Слишком высоко задрали акцию, sold before the level counting on 30% WPI rollback : Watson Pharmaceuticals Sector: Healthcare > Industry: Biotechnology and Drugs
<Эксклюзивно для подписчиков>
Trading in essence – it is a very complex and time consuming type of business. At the same time, many perceive it as a path to millions., working for yourself. Deals can be made on your own yacht in some Tahiti, live in grand style, travel, drive cool cars…
In principle it is possible, but let's try to figure out some of the key […]
In April 2006 of the year Victor Niederhoffer (Victor Niederhoffer) appeared at an evening at New York's St. Regis, where about 300 America's leading fund managers. Walking under the gilded candelabra in a lavender blazer, he felt, that again rose to the top of success. 1980-90s. Niederhoffer has built himself a huge fortune and a reputation as one of the most prominent hedge fund managers in the United States.. But he was ruined by an excessive love of risk.: before the Asian financial crisis, he played for the rise in Thai stocks, and during the crisis - to increase the Standard index&Poor’s 500, using uncovered options on the index. When the markets crashed, Niederhoffer lost everything overnight - $ 130 million fund and almost all of his own savings. It seemed, life dealt him a crushing blow, however, he managed to overcome the path up the second time. Speaking to financiers, honoring him in St. Regis, Niederhoffer stressed, how highly he appreciates the “difficult and courageous” decision to reward him after, how it crashed once.
Closed the remaining longs from Friday (Sber, Rosneft, Ursi – handles, RBK by take) Take-profit triggered on Friday, who might have thought?, that he will blow so much today. Now in cache, I watch the market, because. the situation is uncertain. Formally, we are on the sidelines 1210-1390, but going down from this range can have very unpleasant consequences for bulls. but, if the impulse is down from 1300 will be weak – I will buy.
Still the devil knows what happened to the regime. Wake up in 4 morning, lie down in 8, then I get up by force at one or two days with the hope to lie down and sleep all night. The mind is still clouded.
Entered the M30 with long and long range targets. Потом понял, that I'm not yet ready to sit mentally for half a day in position. Refilled normally for a minute.
Closed on the principle "enough is enough for me". In a good way, would cover 1.5024 (would catch the local low).
Maximum drawdown for a trade ~ 12%. Outcome of the transaction +26%.
Already better. I will continue in the same spirit, the main thing is to get enough sleep…
UPDATE
It certainly pleases, but I'm not ready yet. My psyche 8 hours in position would not stand.
Steve Nison, President Nison Research International, Inc. (NRI), was the first who opened the Japanese method of technical analysis known as candlestick charts, for the West. He – an internationally recognized authority in this area, revolutionized technical analysis in the U.S. and Europe, using these methods. He is the author of two popular books: “Candlestick” and “In the face of Japanese candlesticks. He consults worldwide, including the Federal Reserve and the World Bank. In NRI, Mr. Neeson specializes in Internet-seminars and consulting services organizations. Detection of early signals of turning with the help of Japanese candlesticks The wise man is not one string to his bow. (Japanese proverb) Analysis charts candlestick chart has this name because its lines resemble candles. Used by many generations of people in East Asia. Such schedules have been run long before the column histograms or “tic-tac-toe”, but were virtually unknown in the Western world, before I put them into use in 1990. Now this technique is used in plotting the international level many traders, investors and prominent financial institutions.
On this portfolio I work out my market-neutral strategies, you have to do it manually because it is almost impossible to automate, as there are some factors, which cannot be mathematically described. On the real one, this model is also used with the maximum probability of trades.. In fact, the equity curve is better, but again drawdowns by 95% from site problems and there was one case of my mechanical error. Graphs, By the way, the site shows weekends so the lines are not so smooth.
I close the scalping portfolio after completion 1 quarter, tired of this constant website crashes. Since the trade is sent for execution over the Internet, This results in a strong slippage on such volatile instruments, like copper. There have been cases of 30-40 cents when buying and selling. ES is more or less normal also because, which is more liquid. Periodically, maybe I will experiment on it then, what I don’t do in the model.
I leave only the main model portfolio, which I will periodically show. I consider the result unsatisfactory for a number of reasons as mine, and large slippage from the site with its freezes and repeated down time., which is confirmed in the forums by the administrator. Nevertheless, portfolio is a little positive. No doubt, that there are critics. Bargained 8227 Contracts Therefore, I do not recommend using its service until all technical problems are eliminated.. But to use it as a demo and as a site for running strategies is quite fine, at least it calculates statistics. Despite the unsatisfactory result, I still kept good sharpe( more 3) и sortino ratio(more 6). On scalping , basically, getting good statistics is not always possible.