On this portfolio I work out my market-neutral strategies, you have to do it manually because it is almost impossible to automate, as there are some factors, which cannot be mathematically described. On the real one, this model is also used with the maximum probability of trades..
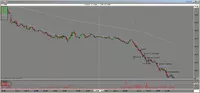
In fact, the equity curve is better, but again drawdowns by 95% from site problems and there was one case of my mechanical error. Graphs, By the way, the site shows weekends so the lines are not so smooth.
Including commission 2.20 per side

| Trades | 209 |
|---|---|
| # Profitable | 114 (54.5%) |
| Avg trade duration | 3.7 hours |
| Annual return (compounded) | 706.3% |
| Average win | $2,385 |
| Average loss | $2,225 |
| Profit factor | 1.3:1 |
| Max peak-to-valley drawdown (historical) | 12.64% |
| drawdown period | Oct 26, 2009 to Oct 27, 2009 |
| Correlation w/ S&P | -0.109 |
| Sharpe ratio | 4.883 |
| C2Realism Factor | 99% |
| Probabilities of future account loss | |
| Chance of 10% account loss | 9.8% |
| Chance of 20% account loss | 2.4% |
| Chance of 30% account loss | 0.0% |