
2017 the year was marked by exponential market growth cryptocurrency, whose dynamics amaze the imagination. Many in the past year were once again convinced that, that the profitability of investments in new assets is often more attractive than the results of investing in shares of even the most successful companies. The prospects for obtaining significant profit on invested funds attract more and more new participants to the cryptocurrency market, including famous players in the world of traditional finance.
Below is a rather entertaining infographic, taken from the Visual Capitalist website. It shows the amounts, which by the end of last year could have become $1000, invested in the shares of well-known American companies just over ten years ago, on the eve of the global economic crisis.
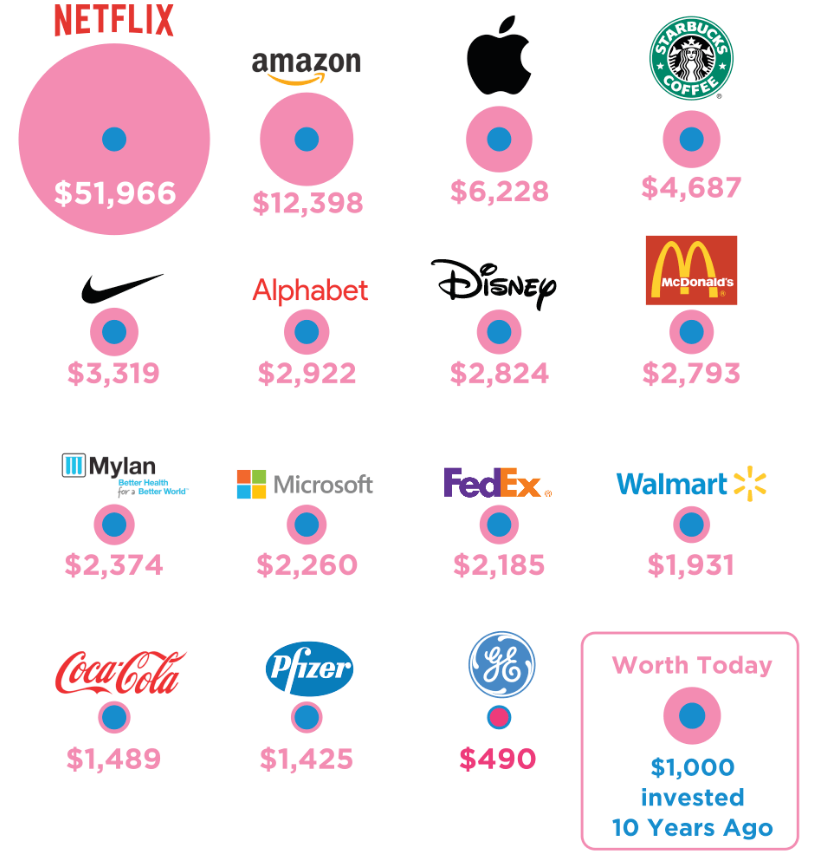
Note, that pre-crisis October was chosen as the baseline period 2007 of the year, when these shares were traded on"Throw away". On the other hand, it would be much more profitable to buy these"blue chips" shortly after the global market crash, for example, in 2008-2009 yy.
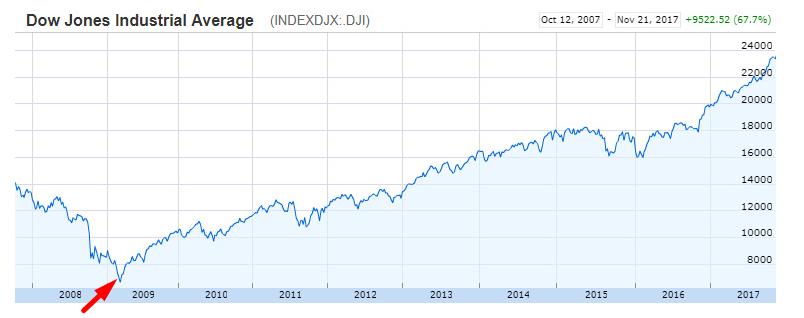
Dow Jones industrial index (the arrow indicates the most suitable moment for buying "at the bottom")
Still a patient and rational advocate of long-term investing, subject to a successful choice of assets and even with a suboptimal choice of entry point, within ten years could significantly increase your capital (at least several times).
The cryptocurrency market makes it possible to achieve comparable profitability in a much shorter period of time (if a, certainly, do not buy “on highs” and do not sell in panic during periods of price collapse). For example, the same $1000, invested in bitcoin just a few years ago, could also grow tenfold:
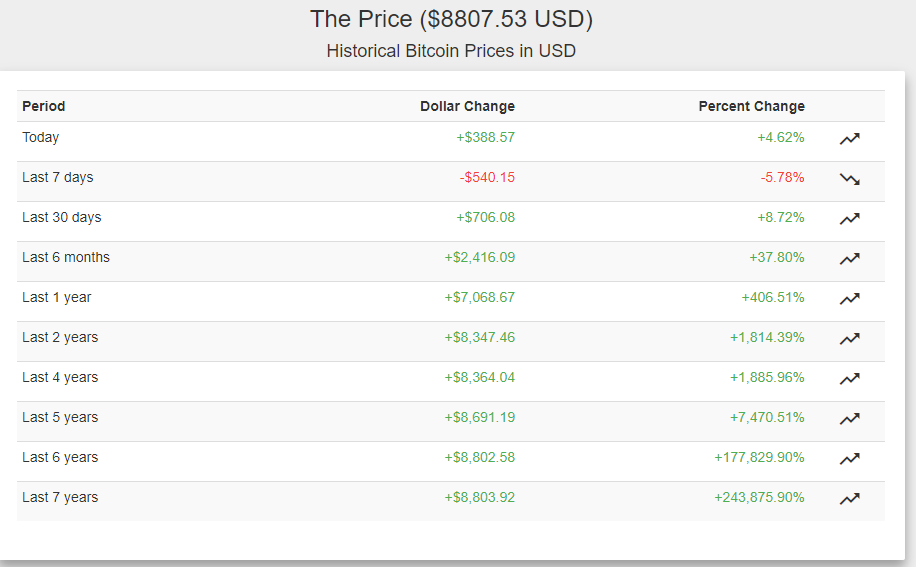
Data: CoinDance(as of 14.05.2018)
Of course, comparison of bitcoin with shares of top companies is not entirely correct - bitcoin appeared only shortly after the start of the global financial crisis (maybe, as a kind of answer to it). On the other hand, if only cryptocurrency appeared a year or two earlier, then the indicators of its profitability were unlikely to be fundamentally different and would look no less impressive.
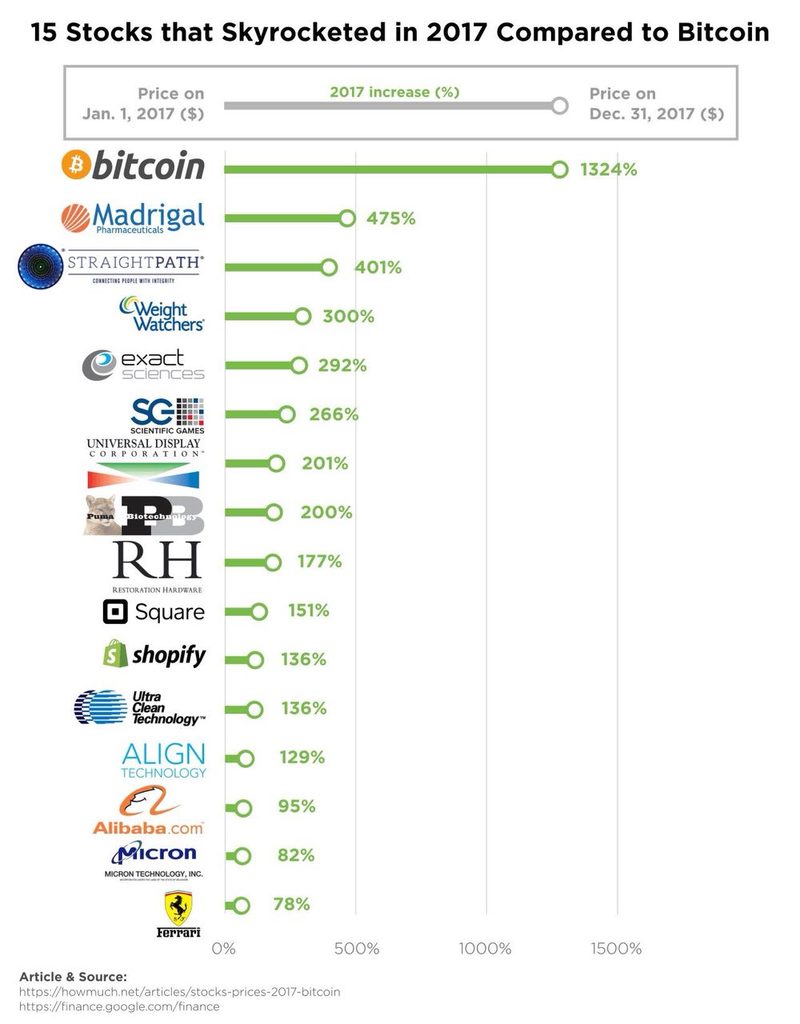
Below is a comparison of bitcoin with the most profitable stocks 2017 of the year:
Other cryptocurrencies are also showing amazing performance. So, over the past year, the second largest cryptocurrency by market capitalization Ethereum increased in price tenfold:
In this way, not hard to guess, why in recent years the cryptocurrency market has attracted institutional investors and is increasingly integrated with the traditional world of finance.
Few will doubt, that cryptocurrencies are very attractive as an object of long-term investment, as well as a tool to diversify a portfolio with different asset classes. However, a natural question arises: why are cryptocurrencies attractive for an ordinary trader?, trading on smalltimeframes?
Let's list the main advantages of this market for a brief- and medium-term trading.
24/7
Unlike the traditional financial market, the cryptocurrency market is devoid of many restrictions. So, what distinguishes it from the stock market is, that it works in the mode 24/7, has no high barriers to entry, at the same time, trading commissions are relatively small. Since the cryptocurrency market works around the clock and without interruptions, there is no need to close positions at the end of a trading day or week.
Low threshold for entry
To enter the foreign exchange market, an investor should have a significant deposit, which is problematic for newcomers to trading. Even more capital is required to enter, for example, to the securities market (for the American stock market, this is from several tens of thousands of dollars). For Bitcoin trading, the minimum possible order is relatively small (usually from 0.0005 to 0.001 BTC, depending on the rules of a particular crypto-exchange).
Lack of correlation with other assets
Cryptocurrencies are also different, that they practically do not correlate with the assets of the traditional financial market. Furthermore, during periods of decline in global indices, buyers often become more active in the digital currency market. In this way, more and more investors see bitcoin as a "safe haven" for preserving capital in times of economic turmoil.
In recent years, even supporters of a conservative approach to investing are increasingly seeking to diversify their portfolio with cryptocurrencies., and at the same time increase the profitability of the latter.
Volatility
Many "dinosaurs" in the world of traditional finance scold digital currencies for their volatility. However, significant price fluctuations, vice versa, attract crowds of traders to this market.
It's not a secret to anybody, that crypto assets are much more volatile than fiat currencies. The latter in the Forex market are traded mainly only "with leverage". For example, when trading liquid currency pairs, say EUR / USD, volatility will be approximately 2-5% per month. Such a small range of price fluctuations necessitates the use of borrowed funds in trading..
The "chip" of cryptocurrencies is, that they can be successfully traded onspot market, without using leverage and, respectively, no stop losses, margin-call, fees for the use of borrowed funds and additional risks.
Intraday volatility of bitcoin can reach, 5, 10 and more percent per day, which is very attractive for a trader.
Significant growth potential
Digital currencies are still an emerging market, which is incomparably small in comparison with the stock market, forex or derivatives market. This indicates significant growth prospects for cryptocurrencies in the coming years..
It follows from this, that even if you someday buy altcoins "on highs" and soon the price of these low-liquid coins will drop significantly, they can be kept "for a long time". The market will recover sooner or later, some coins will sink into oblivion, some will fall even more in price, however, a few of them can grow tens of times, and in the end you will remain in the black.
However, trading in "illiquid" is still a very risky undertaking.. That's why, at least at first, should focus on the top ten or twenty of the Coinmarketcap rating.
It is also worth noting, that blockchain technology is developing rapidly and attracts the attention of not only private investors, but also the largest corporations. The more blockchain-based solutions are being developed and the more investments are directed towards their creation, the more popular cryptocurrencies become and, respectively, the more intensively the capitalization of this market grows.
Why trade, if I may"Walk"?
The data on the profitability of cryptocurrencies over a relatively long period is very attractive, and many have a question: why not just invest in cryptocurrencies using the Buy strategy&Hold and keep them in a cold wallet for at least a couple of years? This question can hardly be answered unequivocally., since everyone has their own strategy, psychology and risk appetite.
Some arguments in favor of trading:
- not all cryptocurrencies live for a long time, and those assets, who are now in the lead, can become outsiders after just a year or two; it is very clearly visible, if you find a screenshot for 2013 or 2014 year, where depicted, say, the first ten top cryptocurrencies at that time, and compare it with current data;
- invest according to the Buy strategy&Hold is quite justified in that case, if there is significant free capital, which can be taken out of circulation for a long period of time;
- you can increase the profitability of investments in cryptocurrencies, if you combine the Buy strategy&Hold with active trading (or at least rebalance the portfolio from time to time);
- giving preference only to long-term investment, trading skills cannot be acquired, That, by the way, may become additional (if not basic) source of income, etc.. d.
As for the arguments for the Buy strategy&Hold, then the image below illustrates them most clearly.:
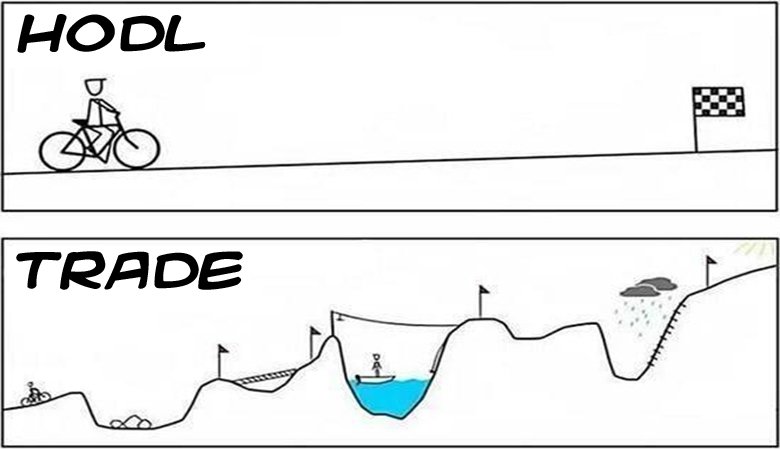
In this way, Trading allows you to make a profit in the short term, and long-term investment does not require frequent activities, as well as learning about various intricate indicators and trading strategies. However, in both cases, a rational choice of assets is required., discipline and balanced decision-making.
The materials of this course are designed to help newcomers to the crypto market to gain basic knowledge. Maybe, this knowledge will someday save someone from the "drain" of the deposit. By understanding the basic principles of trading, it will become clear to many, why should you enter a deal"From the level", why you shouldn't go for broke and "chase the departing train", why are greed and unnecessary emotions so dangerous, etc.. d.
Probably, over time, many will have analogies with real life, where buyers tend to buy quality goods cheaper, and sellers - to sell them at a higher price (but by no means the other way around).
Glossary for the article
"Let" (from English. high - high) - slang expression. Means, that the asset price is currently very high and, probably, he is overrated. Experienced traders often advise beginners not to buy highs. The opposite meaning is term "Low", which is used in relation to the extremely low price of an asset.
blue chips — the most liquid stocks of large and reliable companies with stable returns.
Timeframe — chart time period, used to display the price movement in the market. The most common weekly, daytime, four o'clock, sentries, 30-, 15- and 5 minute timeframes.
Video — direct exchange of one asset for another without the use of leverage. Trading on the spot market makes it possible to "sit out" a significant drawdown without the threat of losing the deposit due to the triggering of a margin call.
Margin call - circumstance, in which the forced completion of the transaction is carried out. This is happening, when the account balance, necessary to maintain the collateral amount of all active transactions, nearing zero. Like a sword of Damocles, margin call "hangs" over traders, who trade using leveraged funds ("With a shoulder") and do not follow the principles of risk management.
"Hodl" - presumably came from a typo in English. ‘hold’ ("hold"). Literally means to keep an asset "for a long time", not selling it under any circumstances.
Levels - price marks, near which many orders are concentrated and where the distribution of buyers and sellers changes significantly (supply and demand ratio). Distinguish between support levels (below prices) and resistance (are above the price). The first of them seem to be holding back the onslaught of the "bears" (sellers), and the latter serve as an obstacle to further price growth.
A source : forklog.com/bazovye-osobennosti-kriptovalyutnogo-trejdinga/
Start trading with free funds, who are not afraid to lose
It is better to store the bulk of cryptocurrency savings not on a centralized exchange., and in a safe wallet. These funds can be considered as long-term investments..
In the same time, Assets "frozen" on a cryptocurrency wallet can mean a short loss for a trader- or medium term benefit, since they are not involved in the turnover. Thus, some of these funds can still be deposited on several cryptocurrency exchanges..
Do not open a "full cutlet" position - it will be quite safe for beginners to practice on small trades, each of which can be limited, say, 1-2 interest from the deposit. Gradually, with the acquisition of skills and self-confidence, this limit can be raised a little. If you can't wait to go to baboutLarger percentage of the deposit, then it is better to wait for the most favorable moment for this - for example, good asset price correction.
Under no circumstances go to the bank for a loan, to then buy cryptocurrency and "play" on the exchange. Don't listen to different well-wishers, telling, how they managed to "make 100500%" and quickly settle with the bank!
It is much better and safer to deposit some of your free funds from time to time.. For example, calculate your personal budget like this, to, say, 5-10% your monthly income would be spent on buying cryptocurrency to top up your deposit on a cryptocurrency exchange. Over time, it will also be possible to increase the deposit due to the gradual recapitalization of profits.
Don't be afraid to lose free funds
Firstly, you have allocated an insignificant part of your savings for trading, is not it? Secondly, even the best and most experienced traders sometimes make mistakes. Losses (and they can occur for different reasons: benches stock exchange, hacker attacks, delisting tokens, loss of private keys from an account on a decentralized site, etc.. d.) and prolonged drawdowns should be perceived as risks with a high probability. Besides, learn from mistakes. If success did not give way to failure, then, I guess, it would not be so interesting.
As before, the cryptocurrency market is extremely volatile and, one might even say, unpredictable. The capitalization of cryptocurrencies is highly dependent on various fundamental factors., lightning-fast influencing the mood of market participants. Important and not very news of the crypto industry can quickly “multiply by zero” even technical analysis layouts from the most experienced traders. The Efficient Market Hypothesis is Good, but should also be carefully consideredfundamental factors (they will be discussed in the following materials).
Get ready for that, that someday you will buy an overpriced altcoin "on highs", and then you will wait for months, until its price approaches its former levels, to at least "break even".
The same bitcoin does not grow indefinitely., there are also quite deep drawdowns. For example, immediately after the collapse of Mt. Gox is the first cryptocurrency to go into a protracted correction, where she stayed for about two years.
On the chart below you can see, as soon after reaching the values above $1000, the price began to fall rapidly. Then, after a complete stop of trading in February 2014 of the year, the price drop accelerated even more. The recession lasted for about two years, confident recovery began in 2016 year.
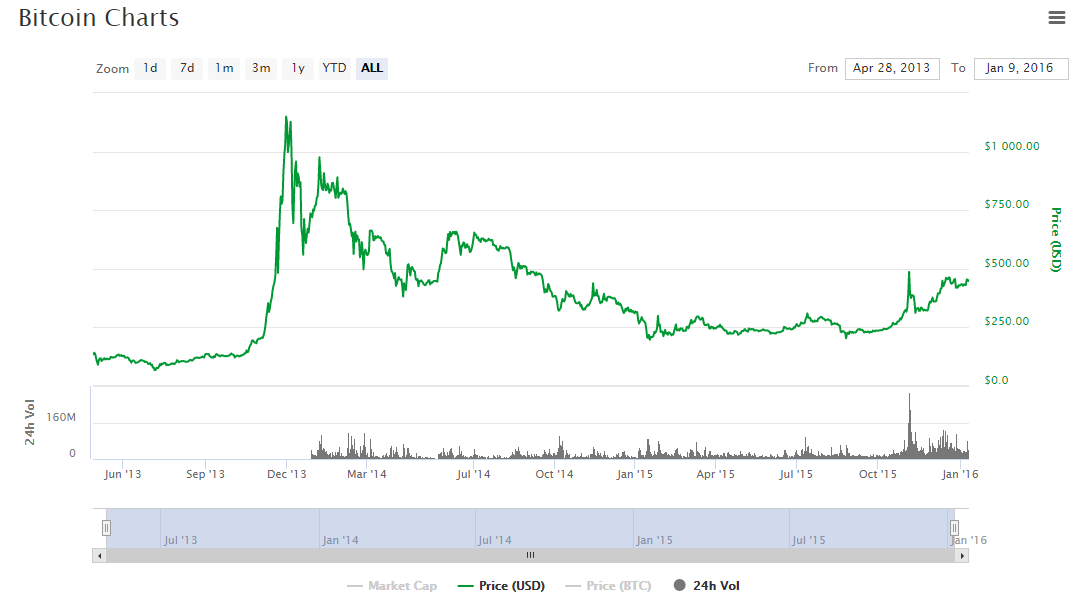
They, who turned out to be more patient and stronger in spirit than the rest, got a good profit in an extremely successful one for cryptocurrencies 2017 year. They, who sold bitcoins at the end of last year by $19 000, and then a few months later he bought them off by $6000, Most likely, satisfied with the results of their investment activities. So, at the time of writing, bitcoin is trading at levels above $8000.
Similar situations occurred with "digital silver" - the Litecoin cryptocurrency., and other assets.
Trade real money. Books, teaching courses and seminars will be of little use without practice.
Don't keep eggs in the same basket
This simple, effective and at the same time the fundamental principle of risk management is calleddiversification. Allocation of risks through the use of various assets, wallets and trading platforms stabilizes the profitability of the portfolio of cryptocurrencies and protects against the loss of everything at once.
So, you should not dwell on any one "super fashionable" crypto-exchange. Each of them has its own advantages and disadvantages., as well as your own set of coins in the listing. For example, Poloniex has a simple, intuitive interface and a fairly rich assortment of altcoins. Bitfinex has more advanced analytics, charts from TradingView, however, interaction with this exchange can cause difficulties for novice traders.
Also, you should not get hung up on any one digital currency., whatever growth dynamics it shows. Do not forget: diversification not only reduces risks, but also can increase the return on investment.
Buy cheaper, but sell more expensive
When people come to the regular food market, they try to buy vegetables of acceptable quality at a relatively cheap price. Most people don't buy the most expensive products on the market, regardless of their freshness and quality.
Getting on the stock exchange, many newcomers to trading do the opposite. When you see a graph of a rapidly growing asset, many are trying to "jump into the last car of the departing train", whatever it costs them. Moreover, they often do not even think about, that after growth there is always a decline, and vice versa. In most cases, after buying "on the highs", a beginner trader will be disappointed - the price begins to decline sharply. Rapid growth is fraught with a strong fall in the price of an asset.
An exception for opening a trade can be, if a, for example, the strategy involves trading on a breakout of the level. However, it is best for beginners to follow the simple principle at first - “bought cheaper, sold more expensive ". Even if you observe only this rule and adhere to the elementary principles of risk management, you can get more or less stable profit. John Rockefeller not in vain once said: « Buy, when blood is pouring in the streets ".
Many people buy and sell, looking at the crowd and reading the trollbox. A successful trader should not follow the crowd, but against her, selling an asset, when the bulk of not very experienced players feel euphoric and continue to shop. It's better to buy, whenhamsters only just beginning to feel painful annoyance. In other words, always buy from pessimists, but sell to optimists.
Choose liquid cryptocurrencies
Many investors recommend setting aside a significant portion of the crypto portfolio for bitcoin. This is not just a tribute to the first cryptocurrency - there is a certain logic here. Firstly, bitcoin is the leastvolatile, steadily growing crypto asset. In other words, the first cryptocurrency usually has a higher Sharpe ratio than most altcoins. Secondly, often many altcoins lose value over time (especially in relation to bitcoin).
To date, the statement that, that bitcoin's "crazy volatility" has already somewhat lost its former relevance. So, at the end of last year, the daily volatility of bitcoin for some time was comparable to the range of fluctuations in oil prices and was lower, than Twitter stock:
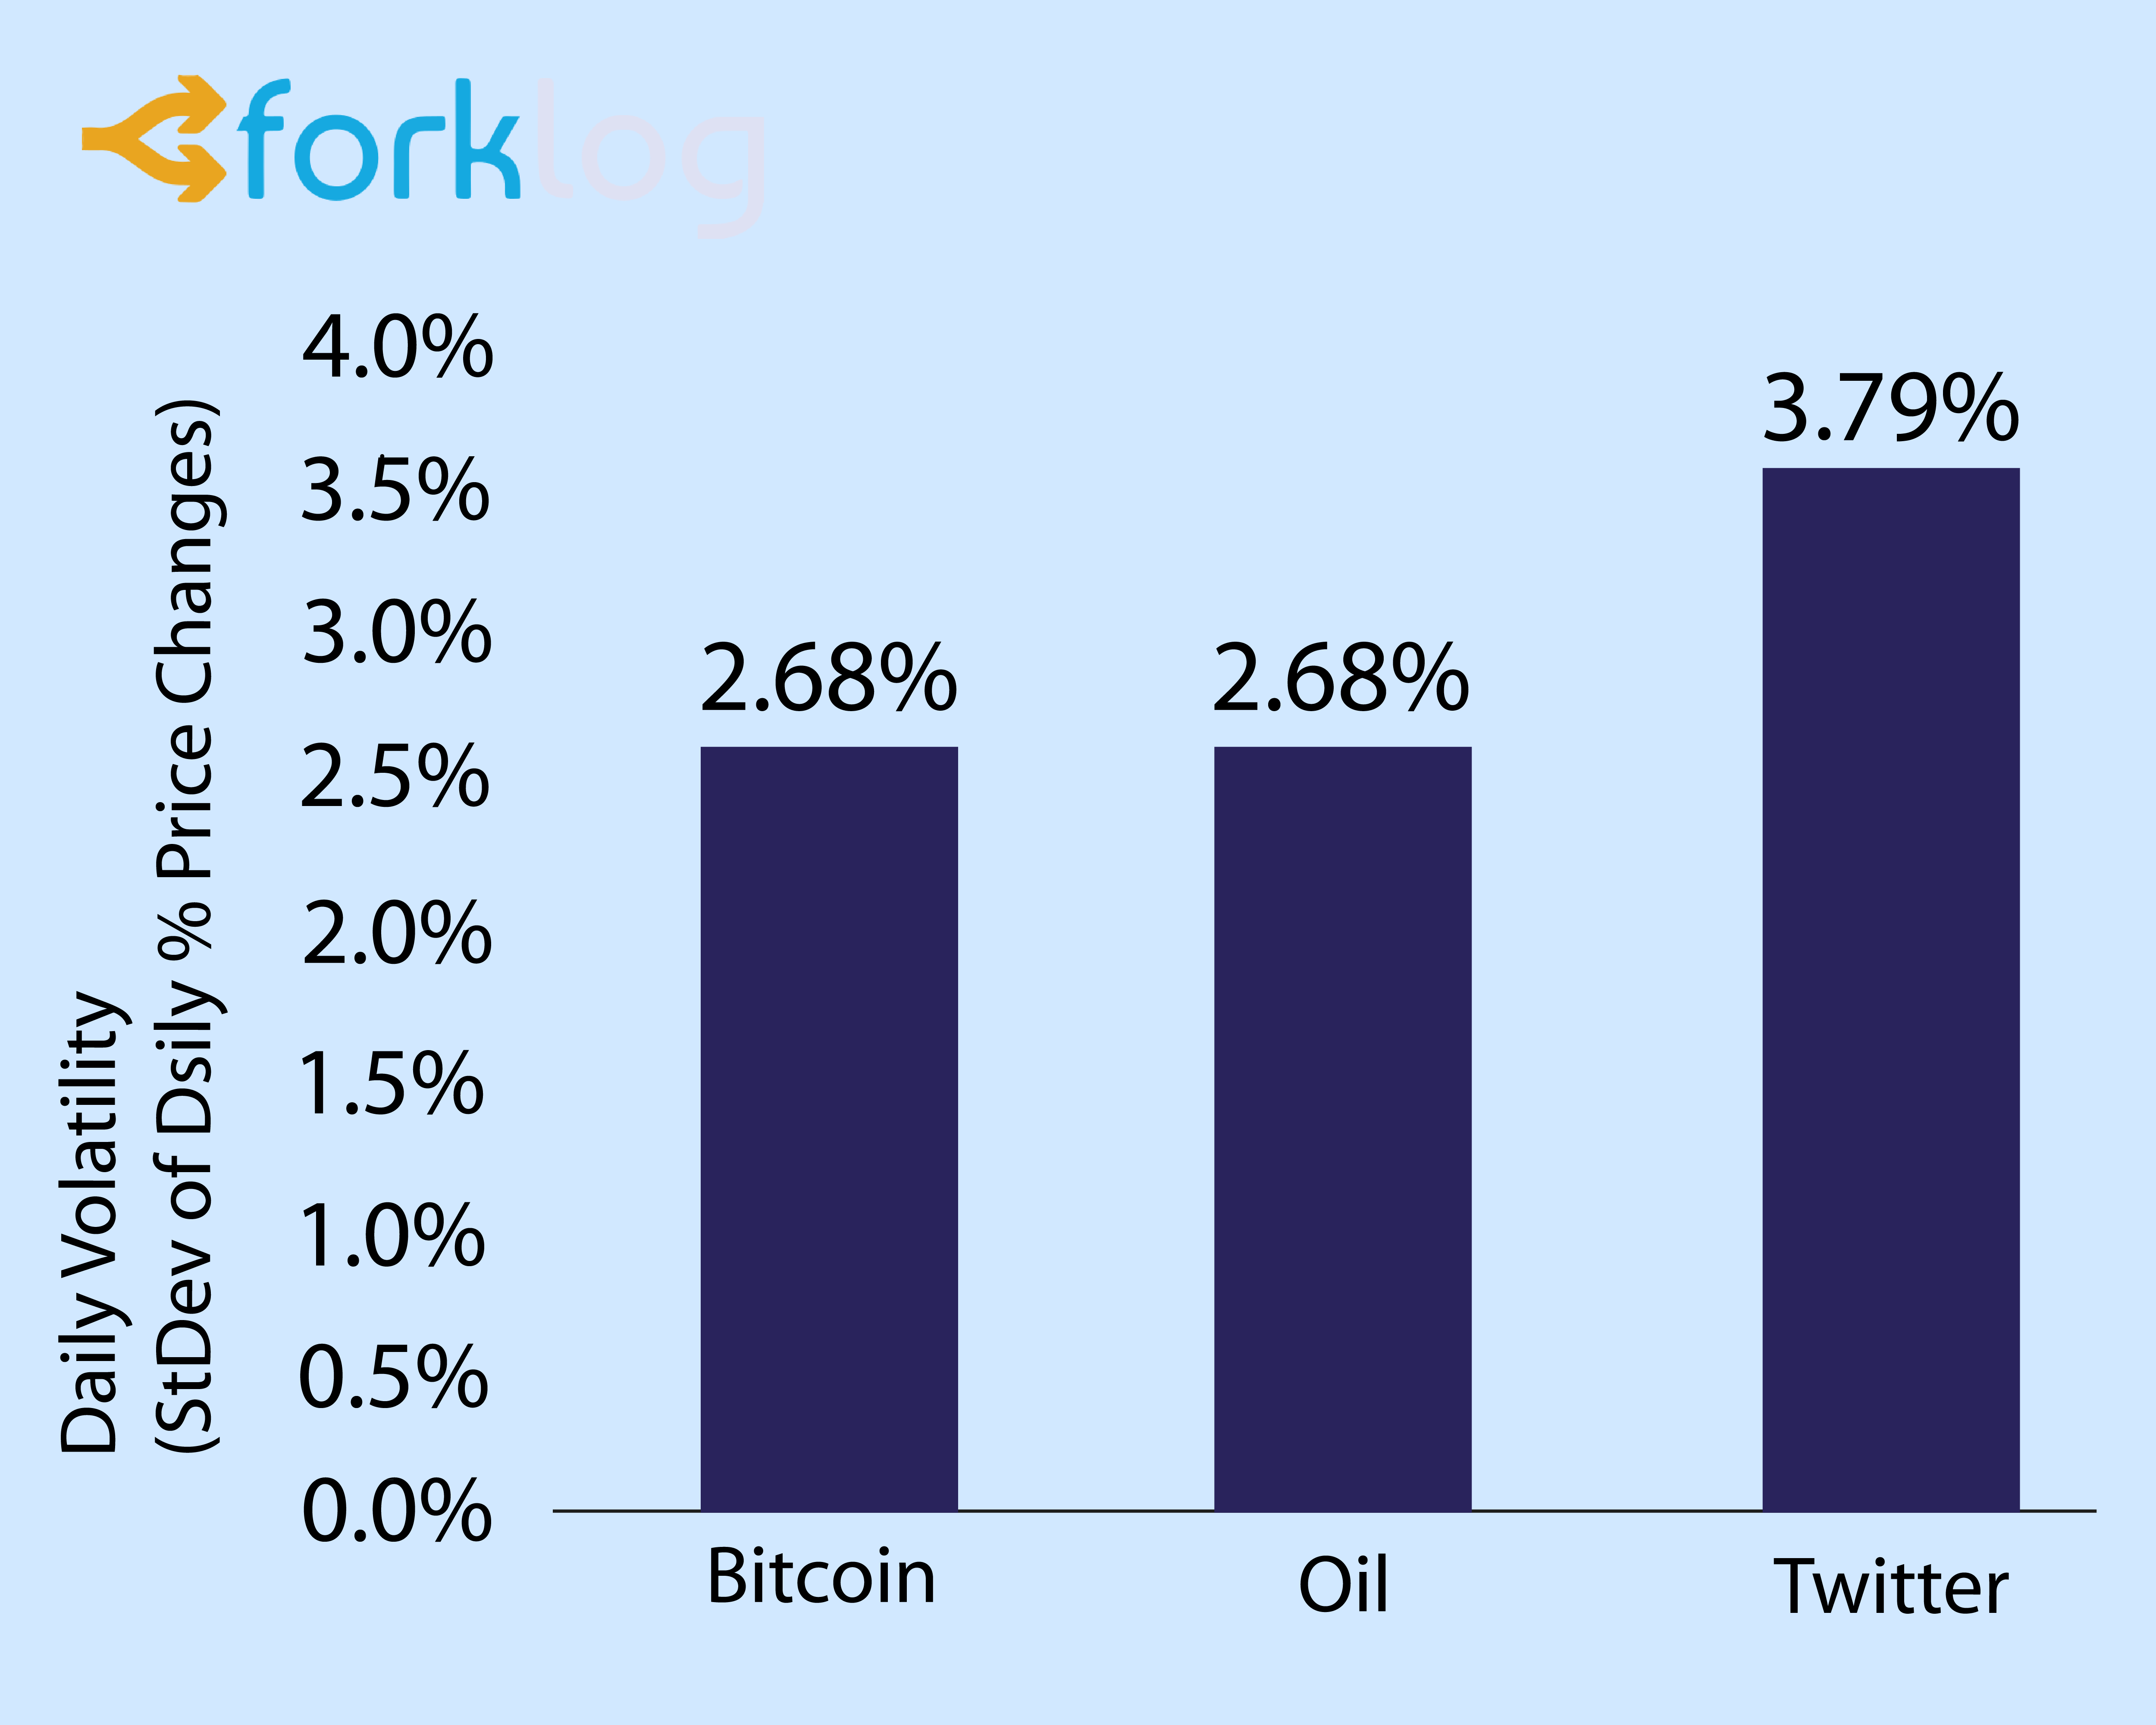
A source: Placeholder, CoinDesk, Bloomberg
In the following graph you can see, that as the demand for bitcoin grows, development of infrastructure and growth of its price, the volatility of the cryptocurrency is also decreasing. She's much lower now, than a few years ago, and its average for 30 days, the value rarely exceeds the level in 5%:
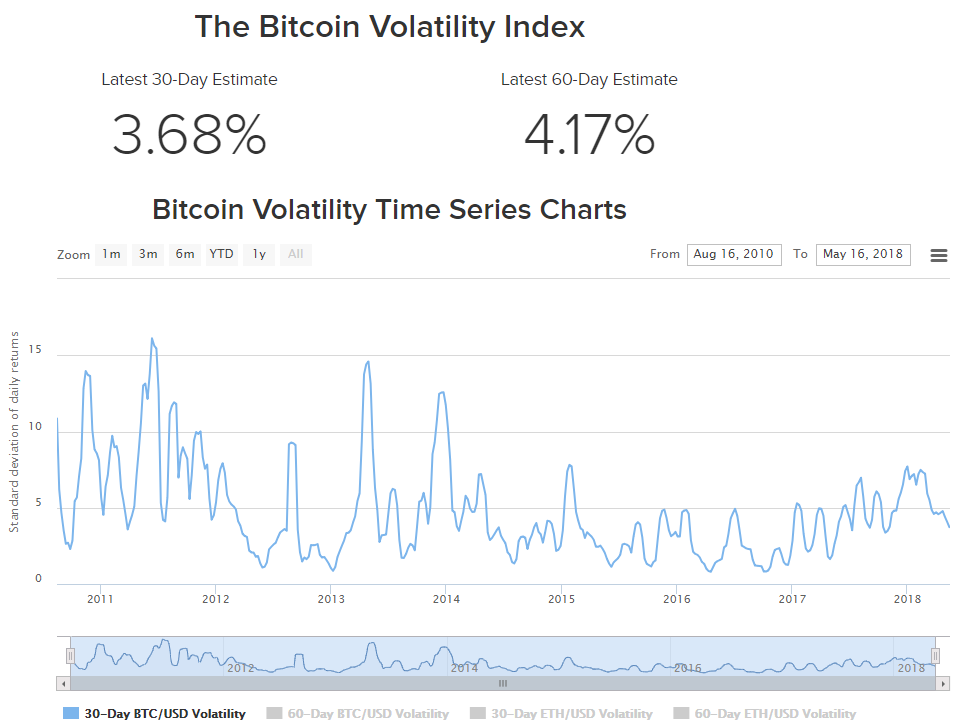
Data: BuyBitcoinWorldwide(as of 17.05.2018)
To finally make sure of the relatively low volatility of the bitcoin price, can be compared to liquid altcoins, including Litecoin and Ethereum (ETH). Besides, according to the head of CME Group Terry Duffy, integration of cryptocurrencies with the traditional financial market will help reduce their volatility.
Another argument in favor of highly liquid cryptocurrencies is the fact, that they are less at risk of scam. So, for top altcoins, usually, there is a serious development team. Also, they are more willingly included in the listing of the largest crypto-exchanges., who pay, in particular, attention to capitalization, transaction volume, reputation of the project, etc.. d. Liquid altcoins attract crypto investors from all over the world if only because, what are at the top of the ratings, such as Coinmarketcap, and therefore more often than other cryptocurrencies come across everyone's eyes.
Altcoins with high capitalization and high trading volume are much less susceptible to delisting risk and have relatively low volatility. Among other things, such cryptocurrencies, like Ethereum, DASH, Litecoin and t. d., support many multicurrency crypto wallets, which means, that traders do not have to think long about, where to withdrawprofit from trading (or "wind up the rods" in time in the event of a threat to the exchange scam).
It is much better and even more enjoyable to trade in, you know something about something and the success of which you least doubt. Project coins, which is being actively and fruitfully worked on, less risk of suddendump.
Don't believe that, who speaks, what $100 enough, to get rich on the stock exchange
The larger the deposit, the more opportunities for implementing effective risk management. In other words, the less percent of the deposit falls on each separate order, the less the risk to drain capital. So, if you have at least a few thousand dollars in your account, then you can set not 1-2, and immediately tenorders on various currency pairs, without risking all means. Also, on the same currency pair, you can place several orders from different levels at once..
Of course, you can guess the price movement of a coin, bought before on $100 at the very bottom. After a while you can get $1000, and even do x20. On the other hand, with an unfavorable outcome of events and a sharp dump, amount in $100 can quickly disappear.
As stated earlier, you shouldn't go all-in and put everything on one "hype" crypto asset. It is better to gradually capitalize profits from small trades and build up a trading account. When the capital grows to a decent amount, then the same 1-2% from the deposit with "conservative" 10-30% profits from the transaction will bring tangible income every time.
If you have all $100 - do not rush to start trading - save up a little more, or just put them "for a long time" in bitcoin. Try not only to multiply "money with money" on the stock exchange, and also just keep that, what is.
More trades - more profit
This point overlaps with the previous one in many ways.. Don't bet everything on one coin, trade multiple cryptoassets. If on small orders the profit is still imperceptible - do not worry, consider it a useful workout.
If you really want to motivate yourself with the first tolerable profit from trading, trade with several pairs, trying to implement small, but profitable trades more often. Thus, with a small capital, you will increase the turnover of funds and this will have a positive effect on financial results.. Capital flows are sometimes more important, than its value.
Trade long time frames
At least in the beginning, choose large timeframes. The weekly timeframe can be used to review the general trend and dynamics of trading volumes (Volume indicator). Support and resistance levels are clearly visible on daily and 4-hour charts.. For a more or less accurate entry into a trade, you can use the hourly, 30- and 15 minute timeframes.

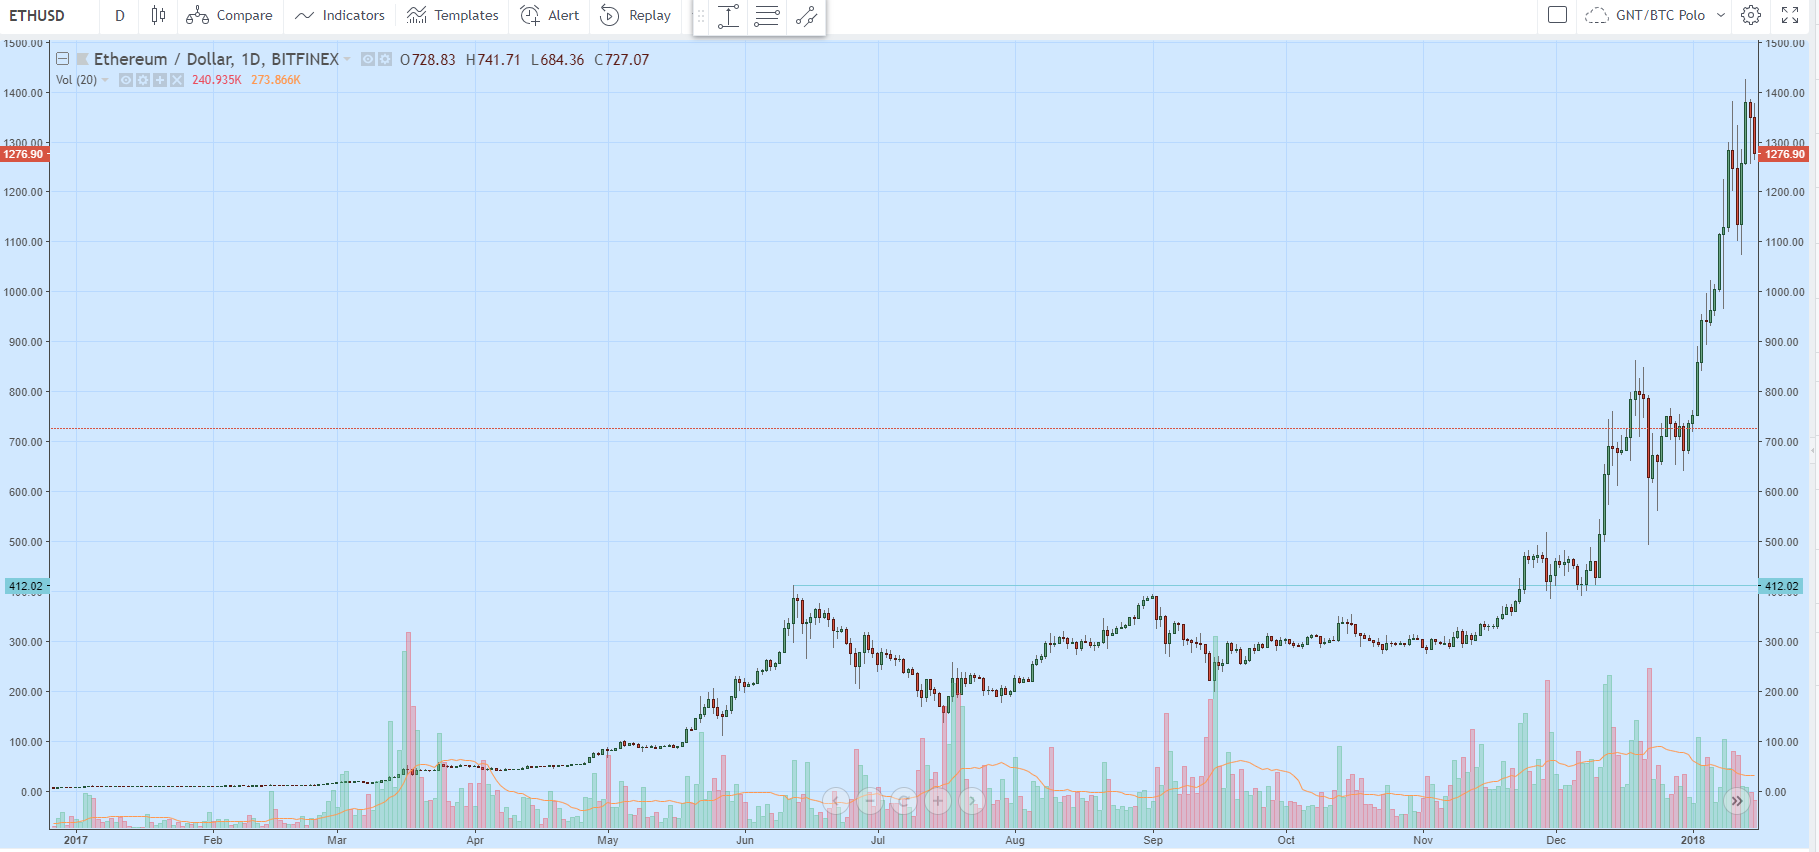
ETH / USD daily chart, covering the second half 2017 of the year
For example, the daily chart of ETH / USD shows a good level in the area $412, held from June high. In the beginning of December 2017 year, the price of "ether" seems to bounce off this mark, which serves as support.
Such price movement "around the bush" traders call "protrading". In this case, you can carefully place a buy limit order at this mark., because the probability is high, that the price will return to this level one more time, and then continue the uptrend.
The question arises: why should newbies not get carried away with small timeframes, because you can make a profit on them almost every 10-20 minutes? The answer is simple - high risk. So, cryptocurrencies are very volatile and on a small timeframe everything can change extremely quickly, and not for the better for the trader.
Pay attention to the chart of the same currency pair, but already on a 15-minute timeframe:
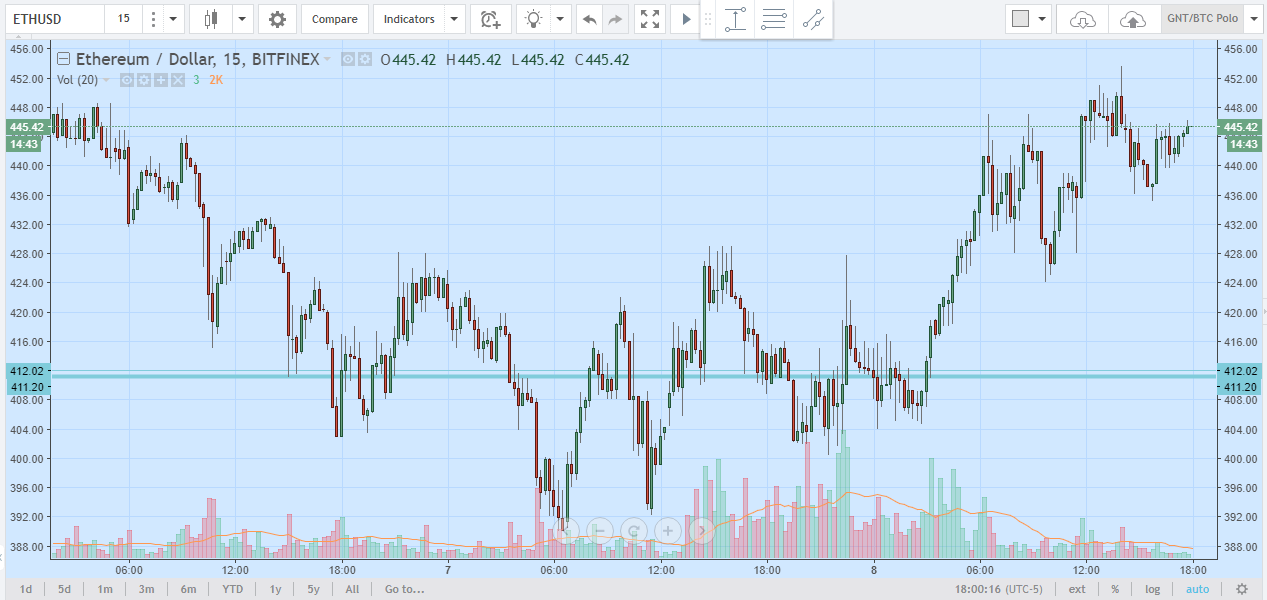
The levels are much less clearly visible here., frequent sudden upward movements, which are replaced by small plums. Most candles have longshadows. There is a lot of market noise here, hindering decision-making.
The intensity of the market noise is inversely proportional to the size of the timeframe. In other words, the longer the time period of the chart, the smoother the price movement looks. On the daily chart, price candles look much smoother, and this allows the player to navigate much better in the market situation.
In this way, on longer timeframes it is easier to choose solid levels, which you can more or less confidently rely on when making decisions about entering a deal and fixing profits. There is a lot of market noise on small timeframes., levels are not well tracked.
Scalpers trading on small timeframes often rely entirely on technical indicators, however, this is not the best start for a beginner.Indicator - just an auxiliary tool, which is not without flaws. Furthermore, they are often late with their values, doing a disservice to the trader.
Buy on hearsay, sell on facts
Rumors may contain as important (or even a leaked insider) information, and misinformation, deliberate lie. Usually, at the moment of the appearance of some important rumor on the market, a new rather powerful and fast wave is born., capable of forming a strong trend.
There is a stereotype, that the principle “buy by hearsay, sell on facts "are guided only by notorious speculators. It's not quite right: many investors often use rumors too, however, in most cases, they identify them with forecasts.
It is a rumor or a forecast - it does not matter for that, who can analyze market information, weeding out unnecessary. Up-to-date information can benefit decisive, quick and rational trader.
On the other hand, there are a lot of sources of information on the Internet. Consequently, the cornerstone of working with information is trust in its source. The latter is based on the authority of the source, its time-tested. Not bad, if the information is confirmed by at least three similar news from alternative, but trustworthy sources. On the other hand, often news release in major publications should be regarded as a signal to exit the position, which has already been worked out by the market.
Howbeit, Twitter accounts of cryptocurrency projects can serve as irreplaceable assistants to the trader, press releases on the official websites of companies, foreign sources like Bloomberg, Reuters, CNBC et al. d. The calendar of cryptoindustry events is also very useful..
The wave is illustrated below, resulting from the appearance of a positive hearing (for negative hearing, the graph will be mirrored about the X axis):
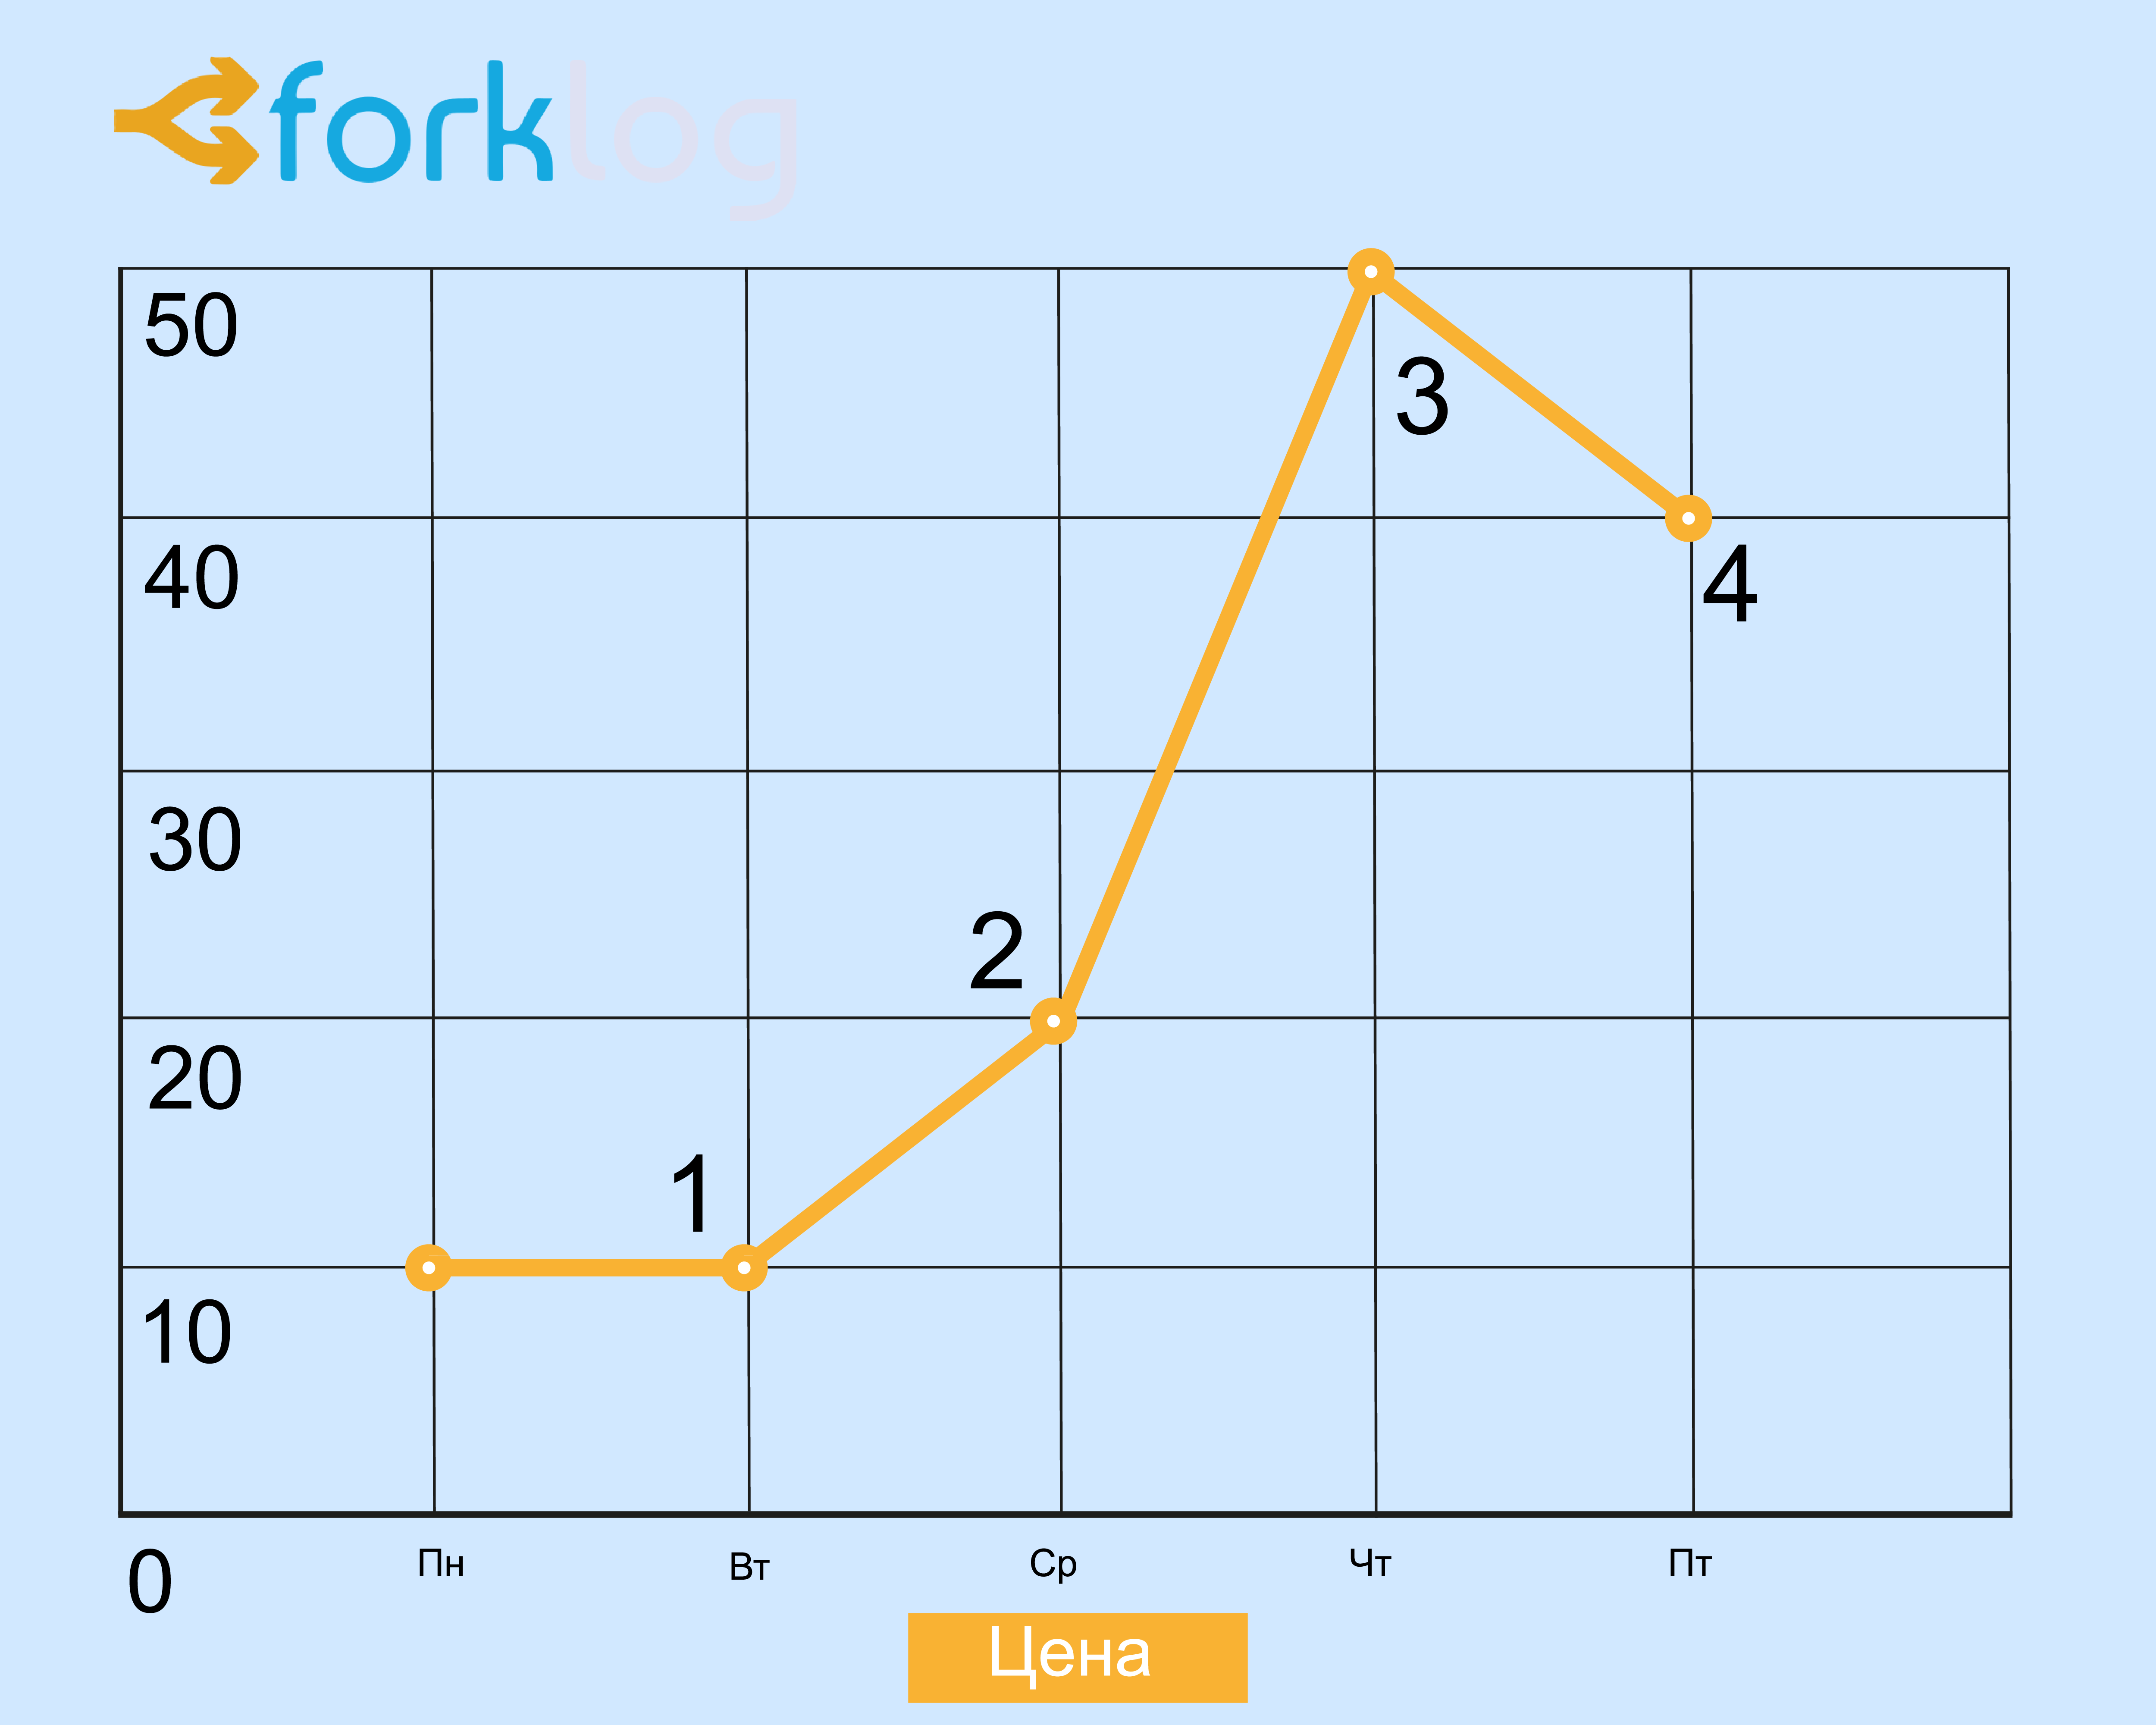
Such a wave usually consists of four phases:
- hearing appearance;
- growth on expectations;
- the emergence of confirming news, profit fixation;
- equilibrium price fixing (correction).
Can be observed, at first sight, paradoxical situation - good news came out, and crypto assets are plummeting in value. This means, that a large circle of people already has information and all the cream has been skimmed.
The main task of the investor with this strategy is to have time to open a deal closer to the first point, to maximize your profit at the end of the hype. It should be remembered that, that the strength of the trend is proportional to the number of hearing recipients.
The risks of this strategy are, what you can not guess with the trend, do not get confirmation of the rumor, or simply miss the first and third phases of the wave.
There is also a great risk of completely confusing the phases of the wave.. For example, it could seem, it's not too late to follow the trend, but in fact, sales are about to begin on the market.
When rumors turn out to be false, then blindly following them can lead to significant losses. At the first sign of market reluctance to trust rumors more, should stop following this strategy.
Don't reinvest all profits
Trading is a job, and work should be rewarded. Income is the best motivator for productive work. Consequently, for that, so that trading becomes an exciting experience and there is always a desire to learn something new, try a fresh strategy or new indicator, part of the profit must be periodically withdrawn to fiat and spent on pleasant things for yourself.
Don't Capitalize All Profits, but only a certain part of it. If money isn't fun, then the process itself can quickly get bored, especially at the first setbacks. In business, profit is more important, not the process itself, no matter how exciting it is. Get your profit!
Do not regret the lost profit
If you closed the deal, fixing 20-30% arrived, while a friend "did x10" - do not regret it and do not envy! They, who go "for the whole cutlet", completely disregard the principles of risk management. Such traders would most likely make x10, but only in the opposite direction (for example, if we entered the deal late, just before the trend reversal).
Trading is not a get-rich-quick scheme. This is a job, and not a game. A trader should fight his own greed and accustom himself to, that the profit on opened orders should be planned in advance. Howbeit, avoid the loss of profits syndrome (FOMO) and do not follow the advice of social networks.
Don't trade with leverage
At least at first, do not resort to margin trading cryptocurrencies. Bitcoin is still volatile, altcoins are even more prone to strong price fluctuations. That is why the cryptocurrency market attracts so many people - thanks to the high volatility, you can quickly make significant profits., and without the use of borrowed funds, as well as related fees and risks.
Cryptocurrency margin trading involves huge risks. The essence of such trading is, that a trader borrows capital at a certain percentage to increase his leverage. A wrong decision can lead to significant losses - with a sharp price movement in an unfavorable direction, the site will first ask you to increase the deposit, and then liquidates the order, fixing significant losses for the trader. The interest rate on borrowed funds also plays a role - these fees are automatically withdrawn at the time of closing the position.
Due to the lack of market liquidity, the candles on the chart of the cryptocurrency "marginer" are often full of long shadows. Each of these shadows is a potential quick profit or margin call.. Is the game worth the candle - you decide. Leverage in the hands of a layman can be disastrous. It is very dangerous to use this tool in conditions of price volatility or when trading low-liquid coins..
Plan your deals ahead
Try to mark the levels for yourself before trading., by which you will close the position, fixing profit (or loss, if you trade with leverage). It will help you stay longer in trading., even with an undesirable financial result.
If you did 2-3 deals in a row at a loss - go for a walk, after all, a negative financial result suggests, that something went wrong. In such cases, it does not hurt to freshen your head., to understand, what exactly was done incorrectly.
Accumulate knowledge gradually
Do not get carried away from the very beginning with a lot of sophisticated indicators and a bunch of trading strategies. At first, you need to learn the basics of trading and risk management., several chart patterns and the most popular indicators (for example, moving averages, MACD, Stochastic, RSI, Bollinger Bands), as well as the settings of the last. You should also learn to see the levels., build price channels and understand major candlestick patterns.
Shouldn't think, that minimal knowledge of technical analysis will quickly pave the way to the holy grail. TA is just a tool, a kind of superstructure, complementary to fundamental analysis.
Mastery comes with practice. Overloading with theory without practice will only cause confusion and frustration with trading.. Output: don't complicate!
Glossary for the article
Trollbox - mini chat, which can still be found in the interface of various cryptocurrency exchanges. Reading entries in the trollbox is strongly discouraged, as they abound in misleading calls. For example, often, when the market is already overheated and it is time to close long positions, in the mini-chat, calls are heard in the spirit of “Buy, fools!».
Delisting — exclusion of assets from the list of trading pairs of the exchange. Delisting can happen for various reasons.: low liquidity, regulatory risks, failures of developers, etc.. d.
Hamster (hamster) - new to trading. He usually follows the lead of the crowd., often reads the trollbox and is guided by trade signals from Telegram chats. Hamsters are often bought on highs with all the ensuing consequences.. As soon as the market starts selling, they often dump the asset at a bargain price, because of what they then feel psychological discomfort.
Japanese candles — a popular way among traders to display the price on the chart. More details about Japanese candlesticks and popular patterns based on them will be discussed in a separate article..
Candle shadows. Japanese candles are composed of bodies and shadows. The former show the difference between the opening and closing prices, and shadows indicate price highs and lows.
Indicator — class of indicators, calculated on the basis of historical data on the dynamics of asset prices. Technical indicators are used to predict future asset prices or simply their direction of movement (trends), based on their past behavior.
Volatility - a measure of uncertainty or risk regarding the magnitude of the change in the price of an asset. High volatility means, that the price of an asset can fluctuate significantly and within a short period of time. In this way, the higher the volatility, the higher the risk.
Liquidity — the ability of assets to be quickly sold at a price, close to market. The liquidity of an asset can be indirectly characterized by a large number of purchase and sale transactions in the market. In this way, assets, which can be bought or sold quickly and easily, considered liquid. It's safer for an investor to invest in liquid assets, than illiquid, since the first assets are easier to transform into cash.
Diversification — risk management methodology, the essence of which lies in the formation of an investment portfolio from a large number of diverse assets. Briefcase, including various assets, can potentially generate higher returns with less risk.
Fundamental analysis - actions, aimed at studying various qualitative and quantitative factors, which affect the price of the asset (most often average- and long term), using financial statements, macroeconomic indicators, statistics, etc.. d.
Profit - profit (English. profit).
Dump, basin - sharp price drop.
Warrant, application - order to execute a trade operation. There are a variety of order types on modern exchanges. (they will be discussed in the following materials of the special project).
Technical indicator — class of indicators, calculated on the basis of historical data on the dynamics of asset prices. Technical indicators are used to predict future asset prices or simply their direction of movement (trends), based on their past behavior.
Margin trading (leveraged trading) — conducting trading operations using funds, provided on a loan secured by a certain amount, which is called margin (English. Margin). Trading on margin carries increased risks, since in this case they increase as potential income, as well as losses.
Scam (from English. scam - "scam") - usually the sudden closure of a project or exchange in the background (or shortly after) termination of obligations to investors.
The main concepts in trading: currency pair, exchange glass, warrant and others
What is a currency pair?
Currency pair - the ratio of the two currencies, which shows how many monetary units of one currency a unit of another currency is worth.
For example, in the ETH / BTC pair you buy the Ethereum cryptocurrency, paying for it with bitcoin. The first currency in a pair is called the base currency., and the second - quoted. In this way, currency pair shows, how much quoted currency is needed, to buy one unit of base.
We, ask and spread
We (Bid) - price, which the buyer of the asset is willing to pay. Ask (Ask) - price, at which the seller is willing to sell the asset. Spread (Spread) - the difference between ask and bid prices.
In simple words, in any market, the buyer names the price, by which he is ready to buy something (we), and the seller - at which he is ready to sell something (ask). This is similar to the situation in the regular grocery market., when some bargainer calls a lower price, and the seller defends a higher. At the same time, both seek to maximize their benefits..
During the auction, the seller may slightly lower the price. Under the onslaught of the seller, the buyer can step back a little and agree to buy from a not so big, but still a discount. During the trading process, the bid and ask gradually approach the point of contact - the equilibrium price. The spread is narrowing. When the buyer and seller agree on a price, which should be paid, and prices, by which you need to sell the product, a deal is in progress (T. is. bid becomes equal to ask).
The processes occurring on the crypto exchange are fundamentally no different from those, what are described above, in a typical "bazaar" scheme. In most cases, the seller does not want to part with the assets at the current, not the most profitable for him, price and prefers limit orders, not executed immediately.
A trader who wants to buy cryptocurrency usually does not seek to do this at the current market price.. He sets an interesting bid price for himself, and the selling trader - the ask price. As a matter of fact, normal bargaining takes place.
For example, if the current market price of any coin is $1, it's quite likely, what the ask price will reach $1,02, the price bid - $0,98 (or even less, depending on the liquidity of the coin).
Spreads are usually small on large markets, where large volumes of cryptoassets rotate daily. Much also depends on the liquidity of the digital currency itself.. For example, on a large platform, the spread of the Ethereum cryptocurrency will be, probably, already, than some YOYOW or Eidoo.
Exchange glass
This concept is called the digital display of the current buy and sell orders set by traders.. The order book looks like a table, where orders to buy and sell an asset are displayed in real time.
To make an exchange transaction, a trader places an order indicating the parameters of a future deal: buying or selling, required volume of asset and desired price. The deal is executed when the exchange system detects a counter order, which fully meets the requirements specified in the order.
If for some time there is no corresponding counter-application, the order is entered into the "order book". Displaying in the order book, the order begins to wait for a counter request.
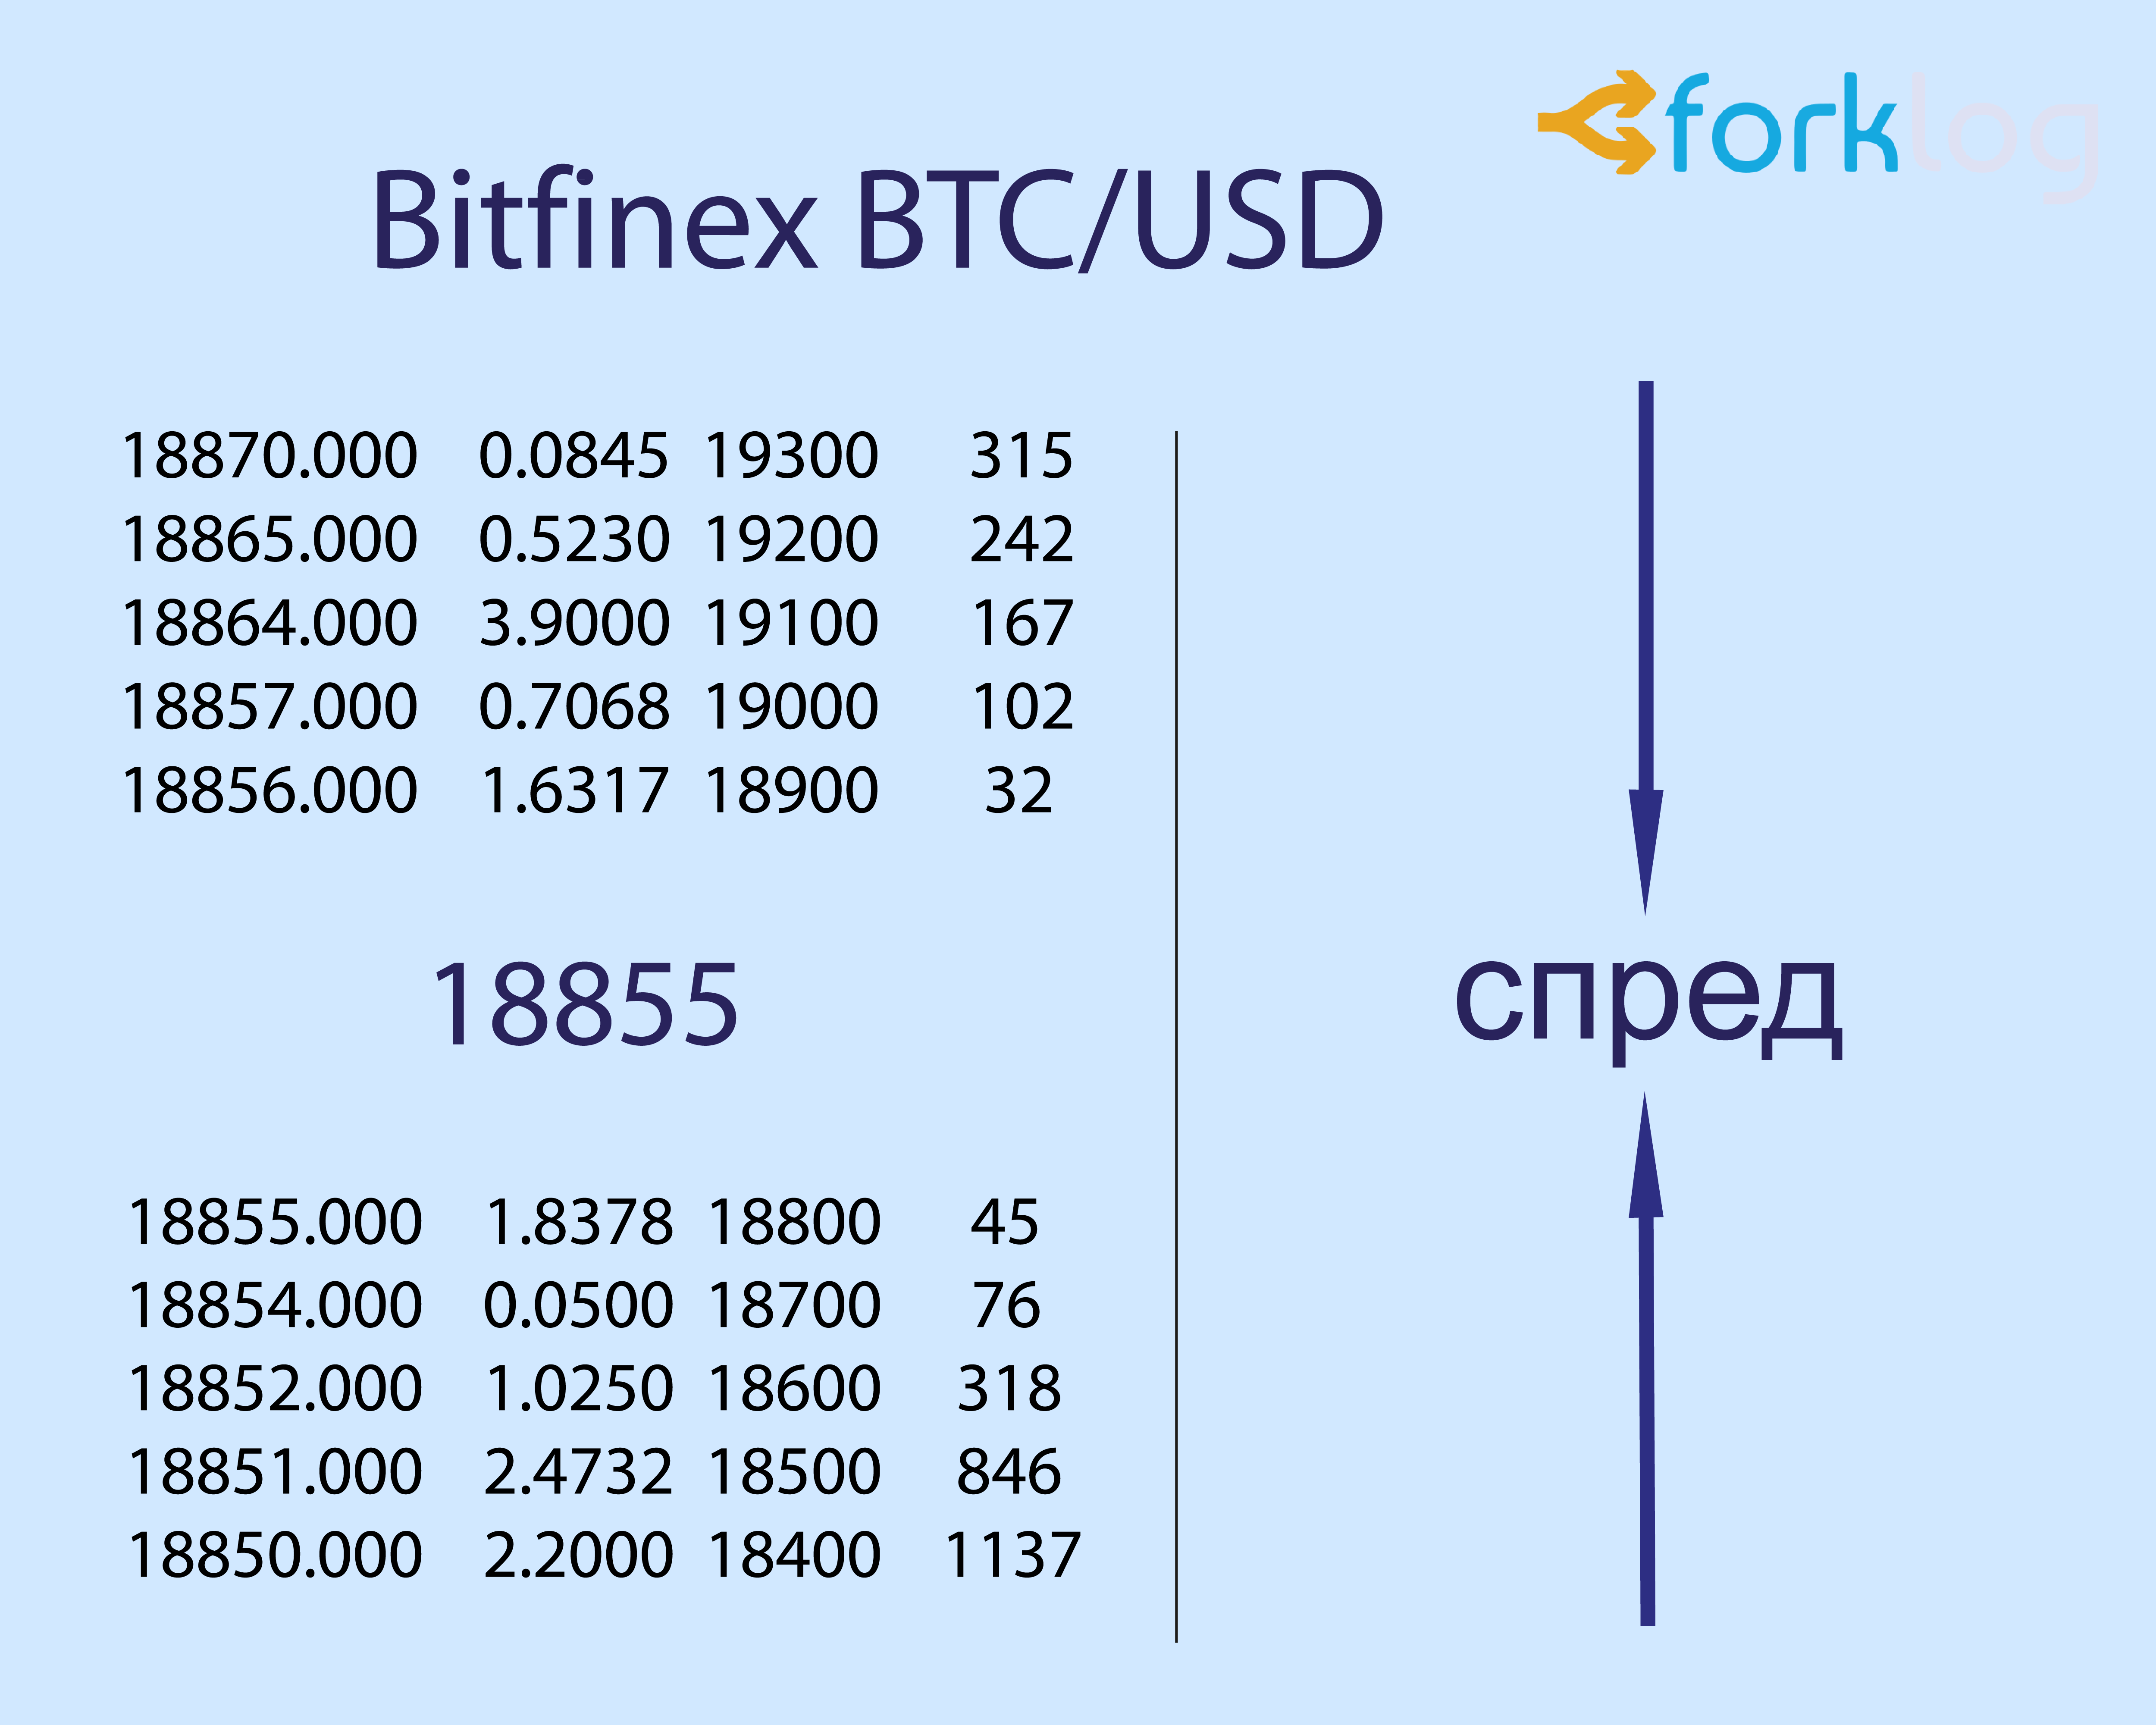
Exchange glass (Bitfinex marketplace; data on 17.12.2017)
The down arrow in the screenshot above shows the ask prices sorted in decreasing order.; up arrow - “bids” growing and approaching the equilibrium price. When the arrows, relatively speaking, collide - the deal is executed.
The difference between the "best" buyer's prices and the "best" seller prices forms a spread. As stated above, the size of the spread may vary depending on various circumstances.
Long and short positions
In the language of traders, long position (‘Long’) - buying an asset in anticipation of an increase in its price.
Short position (‘Short’) Is when a trader sells an asset, waiting for its rate to decline. Opening short positions is possible only when trading "with leverage". Such functionality is presented, in particular, on the BitMEX futures exchange, as well as in the margin trading section (Margin Trading) on the Poloniex exchange (there is a similar section on Bitfinex and many other trading platforms).
Order types
Warrant (exchange order, order, Order) - this is an order created by the client for the exchange to carry out an operation for the purchase and sale of cryptocurrency on certain conditions.
Several types of orders are used in exchange trading.. According to the type of execution, they distinguishmarket, deferred Andlimit orders.
Market order (Market Order) executed immediately after entering the exchange, at the best current price, if there is a corresponding reverse limit order for it.
For example, to execute a market buy order (Market Buy) a limit sell order is required (Sell Limit). To execute a market sell order (Market Sell) a limit buy order is required (Buy Limit). A market buy order is executed at the Ask price, and a market sell order - at the Bid price.
In other words, market orders are executed at the best price, until the number of units of an asset at this price is exhausted (Order quantity)
Pending order (Pending order) - order type, the opening parameters of which are set in advance.
The pending order is executed only then, when there are conditions for its execution. For example: current market price - 8000 USD за 1 BTC. We exposeордер Take Profit - when the price is reached 10 000 USD sell 1 BTC by price 9 990 USD.
This situation means, that at the moment the limit order has not yet been formed on the exchange and it is not in the order book. However, it "hangs" in the trading terminal and waits for the moment, when the price of the last deal (last price) will reach 10 000 USD.
Limit order (Limit Order) Is an order to buy or sell a certain amount of an asset at a specified price.
For example, trader bought 100 certain tokens by $20 for pike. He expects, that the market will continue to grow and the coin will reach the level $25. Since the trader cannot (or doesn't want) constantly monitor your positions, he decides to fix the profit at the level $24.50. To do this, he places a limit sell order 100 these tokens. If their course reaches the mark $24.50, then the limit order will be executed and the trader will make a profit. Without taking into account the trading commissions of the exchange, it will be: 100*(24.50-20)= $450.
The limit order can be easily executed immediately, if there is a counter order at this price (in fact, the situation is the same as in the case of a market order).
Buy Limit Order (Buy Limit) billed at a price, which is below the current market. The trader uses this order, if hoping, that the price will fall first, and then, bouncing off the support level, will start to grow.
Limit Sell Order (Sell Limit) - an order to sell at a specified price. Sell Limit is set at a price higher than the current market price. In this way, the trader uses this order, when he hopes, that the price will rise first, but then, reaching a given level, will turn around and start to fall (T. is. expects to bounce down from the resistance level).
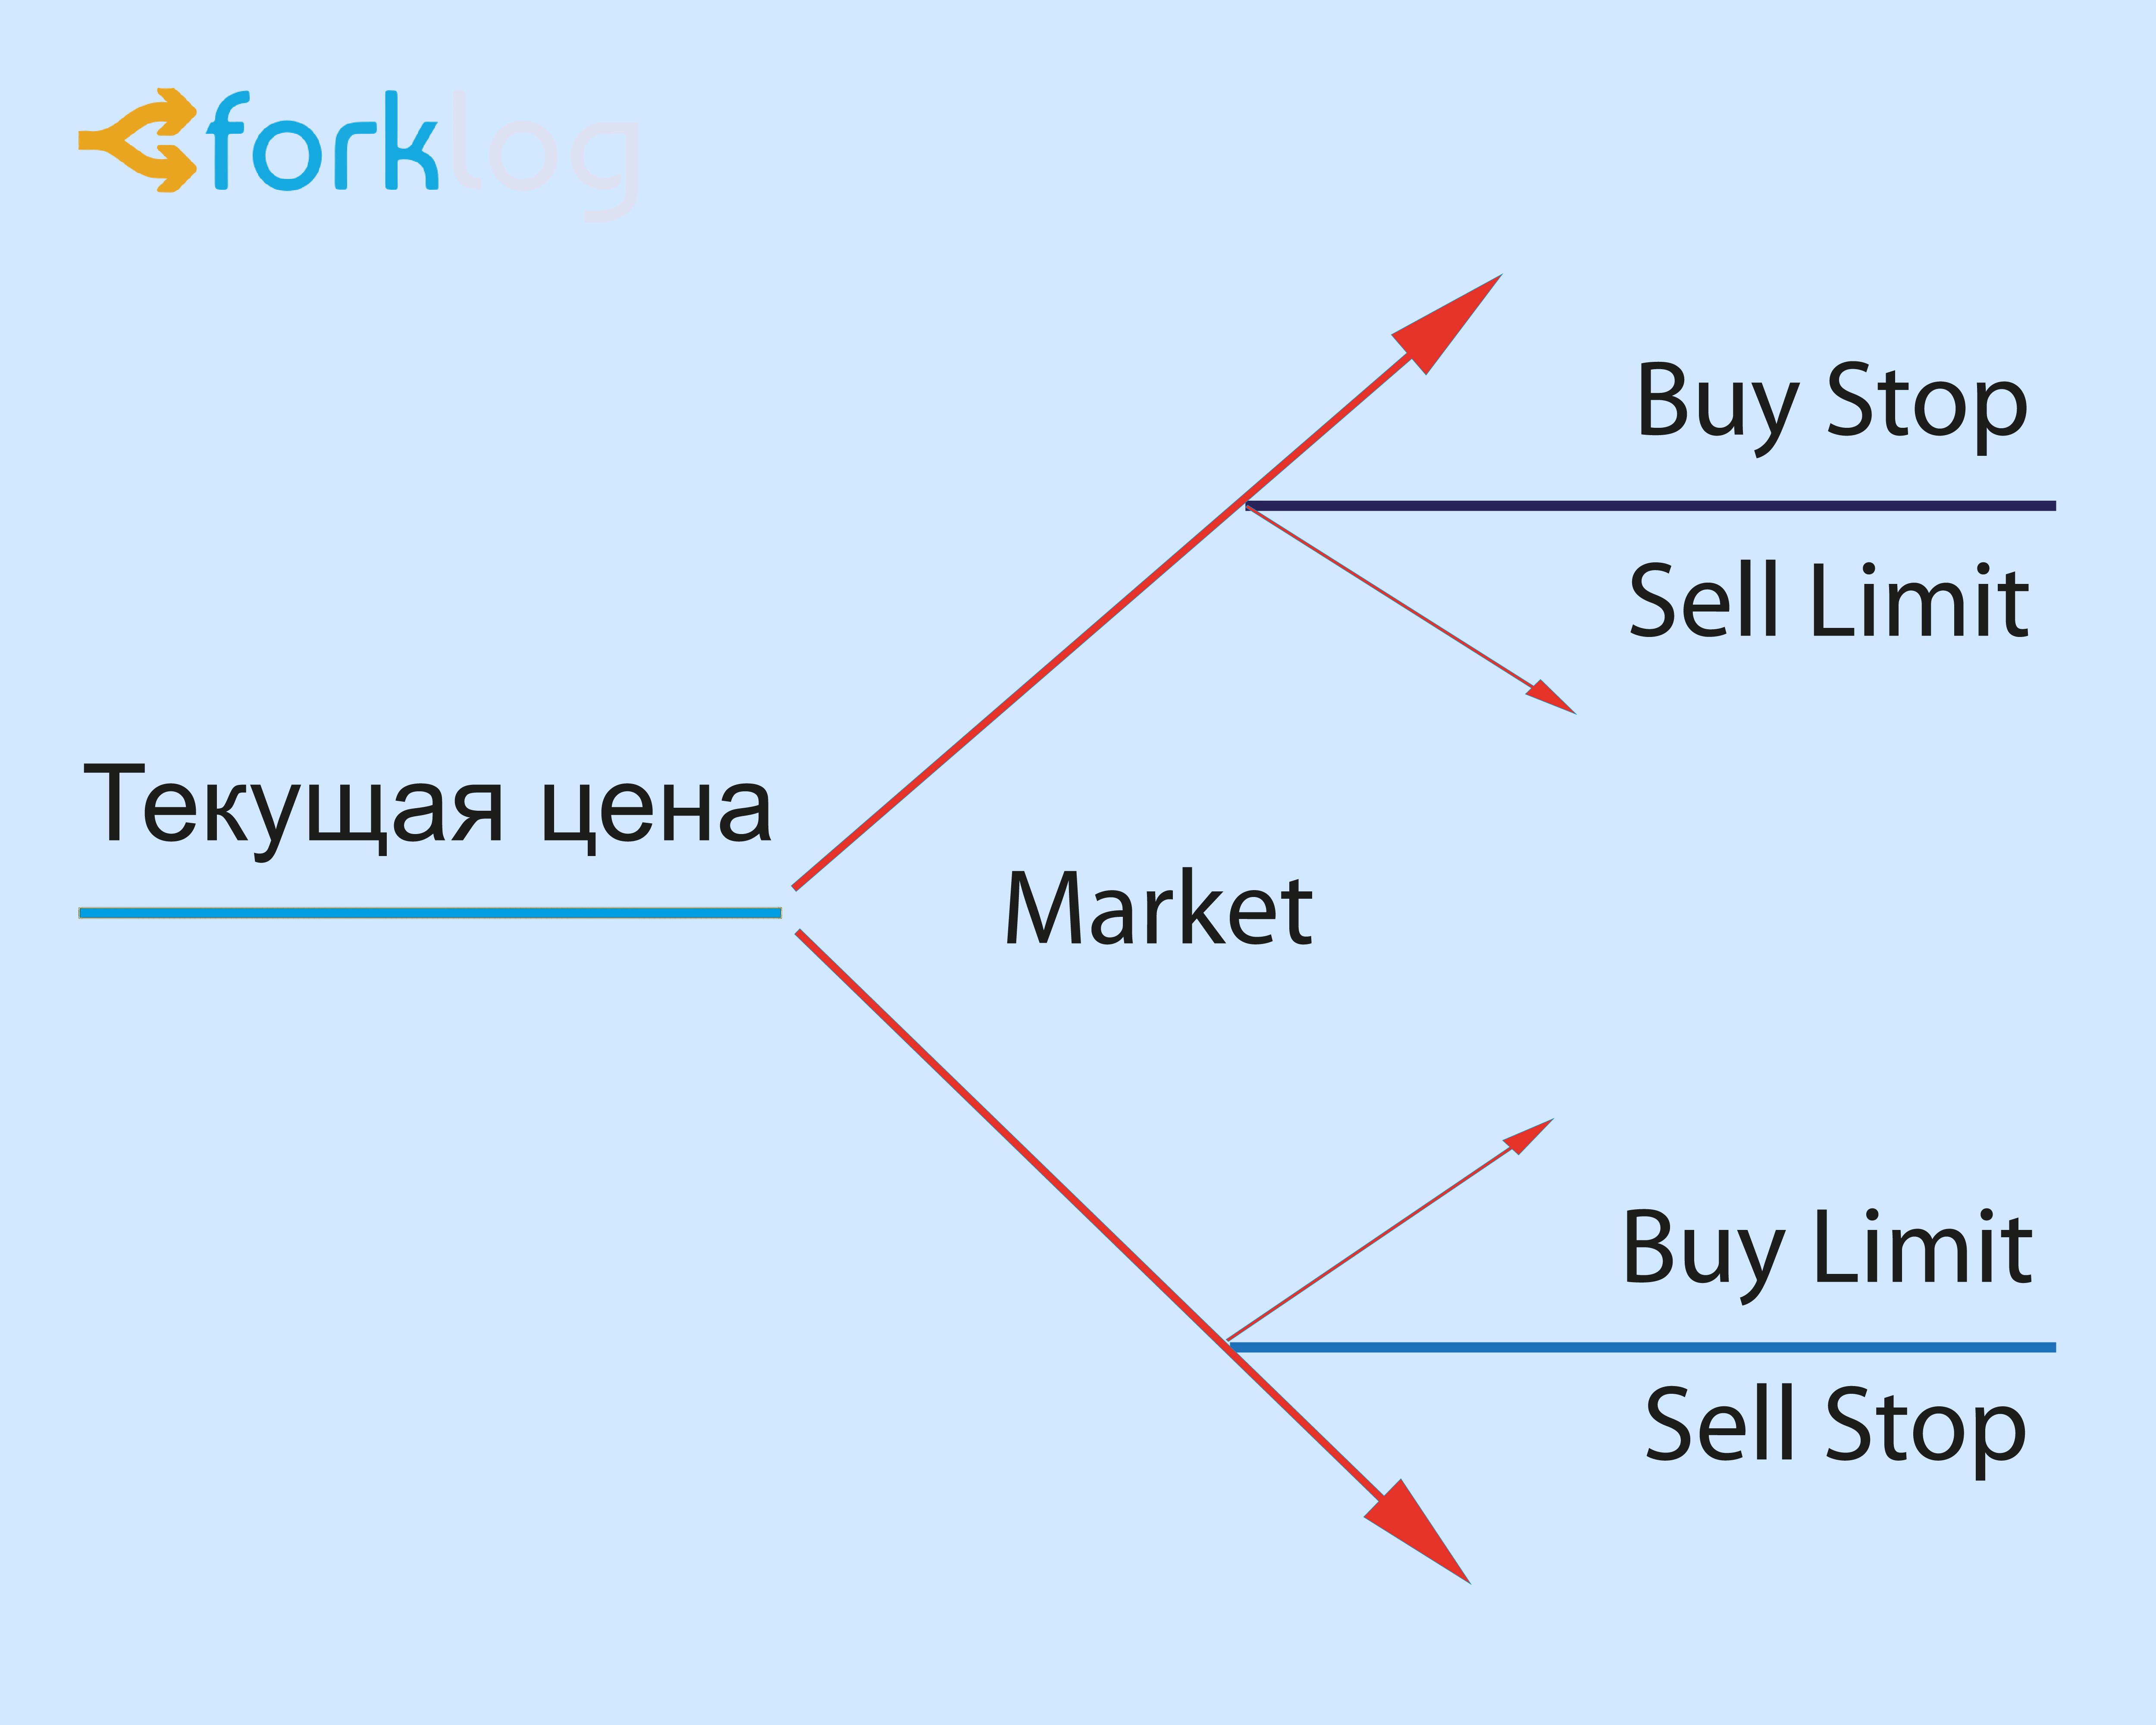
Limit orders
stop order (Stop Order) Is an order to buy or sell a certain amount of cryptocurrency, when its price reaches a certain mark.
Stop order to buy (Buy Stop) - this is an order to buy at a specified price or higher. The trader uses this order, when he hopes, what a rising price, breaking a given level of resistance, will continue to grow. Buy Stop is set at the price, which is higher than the current market. As soon as the price of the last deal equals or exceeds the price specified in the Buy Stop order, it immediately turns into a market buy order. To trigger a Buy Stop order, you need, so that the Ask price is equal or higher than the price, specified in this order.
Stop order to sell (Sell Stop) - an order to sell an asset at a specified price or below. The trader uses this order, when he hopes, what's the price, in its downward movement, reaching a given level, will continue to fall. Sell Stop is set at the price, which is below the current market.
In other words, as soon as the price of the last trade is equal to or less than the price, specified in Sell Stop, the order immediately turns into a market order. To trigger Sell Stop, you need, so that the Bid price is equal to or less than that price, which is specified in this order.
Stop order is used as for opening a position, and to get out of it. In the latter case, the stop order is used as a protective order., limiting losses (Stop Loss; stop loss). In this case, the Buy Stop order provides hedging of the short position (sales), and Sell Stop - protection of a long position (purchases).
Also, any order on the exchange may not be fully executed., and partly (or even not at all fulfilled). To execute an order, you need an opposite order, but it may not appear at the moment, or its size may not be enough for full execution. So, on the Bitfinex exchange it is possible to place Fill-Or-Kill orders (FOK, "Complete or cancel"). Such an order means, that the order must be immediately executed or canceled. Wherein, partial closing or opening of a position on a FOK order is not allowed - the order can be executed only in the stated volume.
Glossary for the article
Bulls - players, trying to make money on the growth of the asset rate. When bulls dominate the market (purchases exceed sales), asset price is growing.
The Bears - They, who make the fall. Actively selling, bears "fill" the course down.
Kit - usually an experienced and wealthy market participant, capable of significantly affecting the price of an asset and even the market as a whole with its large orders.
Fiat — national currencies of various countries (American dollar, euros, ruble, bracelet, chinese yuan, etc.. d.).
trend - a unidirectional price movement that has been operating for a certain time. In other words, this is a clearly visible area of price growth or falling on the chart. Trends are upward (bullish), downward (bearish) and lateral (flat, «Bokovik»).
I am patient («To the Moon») - when the price rises sharply, as if flying "to the moon".
Draining - very sharp depreciation (moment, when hamsters prone to panic sell out the assets they bought on the highs; experienced investors at this time "substitute buckets", placing limit buy orders).
Support — price level, where buyers enter the market. When moving down, the price hits the "floor". At this point, a number of buyers enter the market.. The latter seize the advantage of sellers for some time and restrain further price decline.
Resistance - this level of asset price, in which the growing supply does not allow the price to rise above. As you approach the resistance level, bulls are less and less eager to buy, and bears are selling even more actively, than before. Resistance level means the place of potential cessation of price growth and a possible downward reversal.
Pamp (Pump) — “pumping up” the asset with large volumes of purchases, to cause an intensive rise in its price. The pump usually attracts hordes of "hamsters", who enter the market and support the upward price movement until the very end. Usually a pump is replaced by a dump.
Dump (Dump), Same, that the drain is a rapid downward movement of the asset price, caused by active profit taking from the pump.
Short (Short, short position) - opening a sell position. Used when trading with leverage. The reason for opening a short position is the expectation of a decline in the price of an asset.
Long (Long, long position) - opening a sell position in the hope of an increase in the price of an asset.
Volatility — asset price fluctuations. High volatility implies ample opportunities for profit, however also involves increased risks.
Take Profit - order type, intended for closing a position according to the rules of execution of limit orders. Used to make a profit when the asset price reaches the predicted level.
Stop Loss (stop loss, "Elk") - warrant, designed to minimize losses in case, if the asset price moves in an unprofitable direction. If the price of the instrument reaches the Stop Loss level, the position will be completely closed automatically. Such an order is always associated with an open position or with a pending order.
Fundamental and technical analysis of cryptocurrencies: connection, similarities and differences
Many seriously consider, that in relation to the cryptocurrency market, both of these types of analysis are of little use in practice. With regard to technical analysis (AND) critics usually back up their arguments with statements about the "extremely high volatility" of digital assets, The “dissimilarity” of this market to the rest, strong susceptibility to the influence of news, etc.. d. In particular, in their opinion, Bitcoin's dizzying rise in 2017 year (about 1300%) makes it completely inappropriate to dive into the wisdom of TA, because to obtain a tangible capital increase, it is enough to follow the strategy in cold bloodBuy&Hold.
Criticism of fundamental analysis as a whole comes down to statements about its insufficiently developed methodology, as well as legal uncertainty in the cryptocurrency market.
In all these statements, undoubtedly, there is a grain of reason. However, long-term investments can be combined with trading.. The practice of trading in the cryptocurrency market can bring a lot of valuable experience, especially if the approach to it is complex, based on cold calculation, excluding the adoption of impulsive and unreasonable decisions.
In our opinion, as fundamental, so technical analysis quite applicable for any market, and cryptocurrencies are no exception. On the other hand, this market still has some specifics. So, since the total capitalization of digital currencies is still relatively small, and the analysis methodology is just beginning to be developed, the conjuncture of this market is highly dependent on "loud" news, messages on the achievements of developers and resonant statements of prominent economic and political figures.
So, at one time, news and just rumors from China had a decisive influence on the cryptocurrency market. Soon South Korea took over the role of this kind of "control panel" of the market., USA, Japan and other jurisdictions more loyal to cryptocurrencies.
It's fair to say, that some of the assets of the traditional world of finance often show, though not so dizzying, but still impressive growth.
Below is a chart of the Philadelphia Semiconductor Index (SOX), which includes, in particular, Intel and AMD shares:
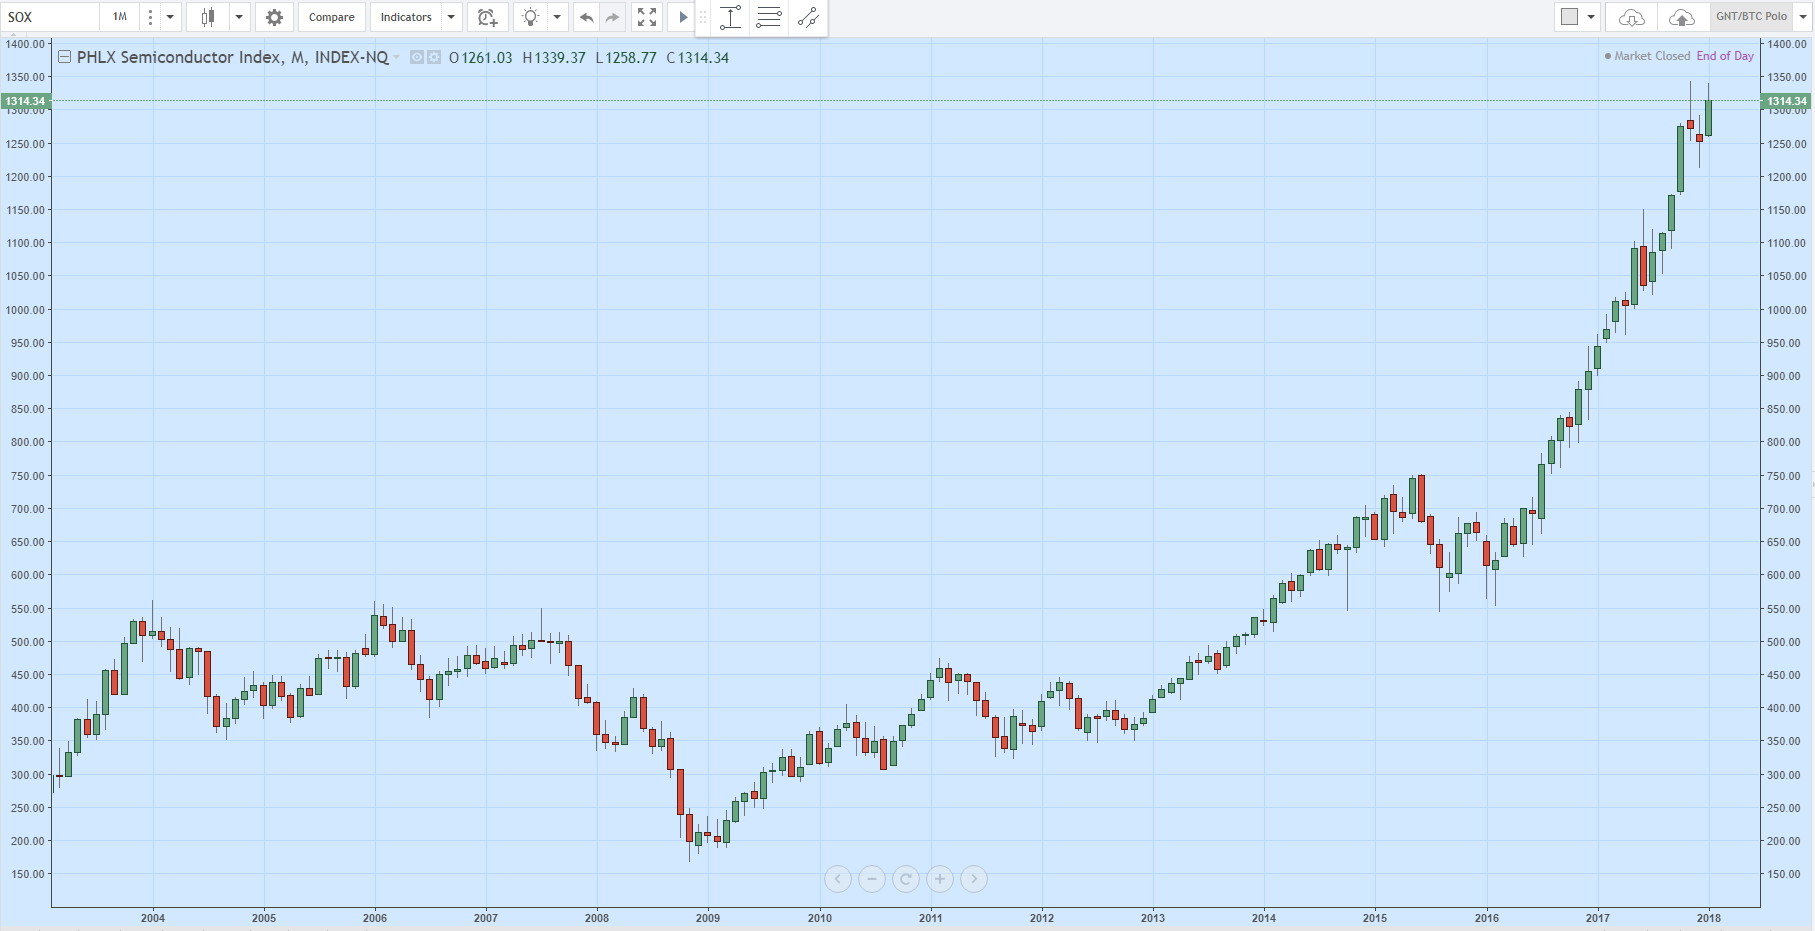
You can notice, how confidently this market was recovering after the World Economic Crisis 2007-2008 years and has accelerated its growth in the last few years.
The main reason for fluctuations in the price of any asset is changes in the balance of supply and demand.. However, this is a very generalized explanation, and to better understand the reasons for these changes, and also make any predictions for the future, an analysis of various factors is required. The latter can be divided intointramarket Andexternal.
The first group includes the following factors:
- Influence on the price by many traders. At the same time, the influence on the market from the side of large players - the so-called "whales" is especially noticeable.. At the same time, there is a stable relationship: the larger the cryptocurrency capitalization, the less the influence of large players, and vice versa.
- Cross-over influence of rates of different currencies. For example, often with a sharp rise in the price of bitcoin, most altcoins are falling. This is because, that many market participants are trying to "jump" into the growing bitcoin, and thus there is an outflow of funds into the first cryptocurrency. The reverse is also very common. correlation between the price of Bitcoin and the rate of its most liquid fork - Bitcoin Cash.
From the above it follows, that when analyzing a particular cryptocurrency, one should pay attention to general market trends, as well as the state of affairs of competing and interconnected cryptocurrencies. For example, often happens, that the overwhelming success of the ICO of some ERC20 token affects the Ethereum rate. On the other hand, the growth of ETH prompts many investors to pay attention to its "obstinate double" - Ethereum Classic (ETC).
Implementation of innovations in the Litecoin cryptocurrency (many have long perceived it as a platform for testing new solutions before their implementation in bitcoin) can also have a positive effect on the rate of the first cryptocurrency. Finally, when any "super-anonymous" cryptocurrency grows, like Monero, it can be interesting to observe the exchange rate of other similar digital currencies, like ZCash, Verge etc.. d.
At one time, the implementation of Segregated Witness had a very positive effect on the bitcoin rate. Future technical innovations could potentially have a significant impact on the rate of the first cryptocurrency., including Lightning Network.
Cryptocurrency prices can also be significantly affected byexternal factors. Let's highlight some of them:
- Declining confidence in the global financial system and national (fiat) currency. For example, devaluation of national currencies often leads to an increase in demand for bitcoin, which more and more people are beginning to perceive as a store of value.
- Tighter regulation of the economy, increased tax pressure on entrepreneurship, dubious measures of national banks (for example, the demonetization of the Indian rupee that caused severe cash shortages), decisions of international organizations, aimed at combating money laundering through offshore companies, etc.. d. All this, to one degree or another, serves as a factor in increasing the demand for cryptoassets..
- Legislative changes in countries with a capacious internal cryptocurrency market. For example, legalization of cryptocurrencies in Japan, tightening regulation of stock exchanges in South Korea, etc.. d.
- media. At one time, the crypto community was stunned by criticism from JPMorgan Chase CEO Jamie Dimon., which negatively affected the bitcoin rate in the short term. On the other hand, sometimes the statements of prominent personalities can have a positive effect.
- The rates of individual cryptocurrencies and the market as a whole may positively perceive messages about the addition of new assets to exchanges. (for example, bitcoin futures on the CME and CBOE platforms, adding LTC to Coinbase, etc.. d.) or about the interest in digital currencies from large financial conglomerates like Goldman Sachs. On the other hand, the market can be pretty shaken by news about exchange hacks or vulnerabilities in popular crypto wallets, etc.. d.
- World Politics News. For example, after the appearance of information about the victory of supporters of Brexit, it was possible to observe an increase in demand for "digital gold".
In the same time, shouldn't forget, that some news is created precisely with the intention of purposefully influencing cryptocurrency rates. Many people believe, that the team of the Bitcoin Cash project often "sins" by this, which carries out carefully coordinated media attacks on bitcoin.
Very important, so that the attitude of crypto investors to news is balanced and critical. Priority should be given to time-tested, reputable publications, which give a link to the original source (entry in the official blog, press release, etc.. d.).
Features of fundamental analysis of cryptocurrencies
Fundamental analysis is designed to assess the real value of an asset, determine, how much its price at the moment corresponds to the realities of the market.
It is worth noting, that the news of the world of cryptocurrencies are released without a clear reference to any chart or economic calendar. So, in the world of traditional finance, relatively regular news on GDP indicators has a significant impact on the market, Inflation, labor market dynamics, volumes of oil reserves, changes in the key rate FED and t. d.
In the world of cryptocurrencies, everything happens much more spontaneously and unpredictably.. You can say, that every new day is different from the previous one. This, in turn, makes it difficult to predict market trends and prices of individual coins on an average- and long term.
Underdeveloped regulatory framework, regulating the circulation of digital currencies, as well as the still insignificant degree of integration of cryptoassets into the traditional finance sector somewhat reduces the role of fundamental analysis for this market. Nevertheless, before investing in a particular crypto asset, you should pay attention to many fundamental factors.
Among them:
- project team, her reputation and background of key participants;
- project roadmap, describing average- and long-term development plans;
- urgency of the problem, which a particular project is intended to solve (demand for the product on the market);
- contentwhite paper project;
- MVP availability (minimum viable product) and the degree of its readiness for mass use;
- features of monetary policy, including maximum supply, features of emission, block generation rate, the frequency of decreasing the reward for miners (if provided) and t. d.;
- cryptocurrency capitalization, Trading volume, price volatility;
- transaction volume and average commissions;
- infrastructure development (including: on which trading floors the coin is presented, what popular wallets support it, has this token ever been delisted on popular exchanges, If yes, then for what reasons, etc.. d.).
Many crypto traders pay significant attention not only to TA, but also news analysis. The latter sometimes have a key influence on market sentiment.. Given the still relatively small capitalization of digital assets, news can have a very strong effect on rates as individual cryptocurrencies., and the entire market as a whole.
On the other hand, there is not a single type of analysis, no approach and no strategy, which would work effectively in 100% cases and were relevant in any market. Consequently, continuously flowing market information should be analyzed comprehensively.
Technical analysis
TA is a set of tools for predicting the likely price change based on the patterns of price changes in the past in similar circumstances.. The basic basis of technical analysis is the analysis of price charts and order book.
Technical analysis uses a variety of charts to display price over time. The analysis itself is partly based on mathematical and statistical calculations..
At the end of the 19th century, American journalist Charles Doe published a series of articles on the securities markets, which formed the basis of the Dow theory and served as the beginning of the rapid development of technical analysis methods at the beginning of the 20th century.
The development of computer technology in the second half of the last century contributed to the improvement of tools and methods of analysis, as well as the emergence of new methods, using the capabilities of computing.
Technical analysis does not considerthe reasons Togo, why the price changes its direction. It only takes into accountfact, that the price is moving in one direction or another, being within a certain period of time within a certain interval of prices. Different methodologies can also take into account trading volumes., amount of open positions, volumes of placed orders for purchase / sale, etc.. d.
In technical analysis, the so-calledpatterns - typical combinations, formed on price charts ("Double bottom", "Triangle", "Flag", etc.. d.).
Are importantprice levels, which are often the previous highs / lows of prices. So, when the price approaches the previous peak values, market participants expect similar reversals and tend to place appropriate trade orders. This, in turn, forms the corresponding resistance and support levels..
Conclusions obtained on the basis of technical analysis may differ from conclusions from fundamental analysis. The latter is based on the assumption, that the current market price of an asset differs from a certain fair value. It should also be emphasized, that technical and fundamental analysis does not take into account the above external factors, including legislative changes, tightening of state regulation in individual countries, etc.. d.
One of the main tenets of technical analysis is that, that price movements in the market take into account all relevant information. This is the so-called Efficient Market Hypothesis., according to which all information, affecting the price of goods, already taken into account in the price and volume of trading. Consequently, there is no need to study separately the dependence of price on political, economic and other factors. It is enough just to focus on studying the price / volume dynamics and get the direction of the most likely market development.
Another TA postulate implies that, that price movements are subject to trends. In other words, set of balance changesdemand Andsuggestions over a period of time can form trends (short-, medium- and long-term). When demand exceeds supply, an upward trend occurs. If supply exceeds demand, a downtrend occurs. When supply and demand balance each other, a sideways price movement occurs. (flat).
Among other things, TA techniques are based on the assumption, that history repeats itself. In other words, market participants in similar circumstances behave the same, forming a similar price dynamics. This allows the use of graphical models of price changes., identified based on the analysis of historical data.
In this way, the following statistical indicators of trading are used as primary information for TA:
- price;
- Trading volume;
- balance of supply and demand.
For price analysis, levels and patterns, traders usually use charts in the formBars or Japanese candles (the structure and features of the latter will be considered in subsequent materials).
Japanese candlestick charts can be used as standalone TA patterns (see Neeson M. "Japanese candles"), and in combination with additional tools in the form of additional geometric shapes and other graphical analysis tools, as well as various indicators, oscillators, etc.. d.
Patterns (such as, "Head and shoulders", "Double Top", "Flag", "Wedge", "Triangle", etc.. d.) are graphical analysis tools. They are usually identified on charts by traders on their own., without the use of auxiliary mathematical tools. Note, that the subjectivity of the assessments of the figure on the graph can significantly affect the result of applying such a method.
Additional TA tools include the following:
- Horizontal line - straight, which serves to indicate price levels on the chart.
- Trendline - an oblique straight line to identify the trend.
- Calculation lines, generated on the basis of mathematical processing of the key values specified by the user (Fibonacci levels, Gunn's line).
- Technical Indicators - Additional Charts, generated on the basis of recalculation of values, contained in the base price chart. They have at least one changeable parameter., the value of which may significantly change the displayed results.
Most popular technical indicators, oscillators and patterns will be discussed in subsequent course materials.
Critics and supporters of technical analysis
There are many successful investors among TA critics. So, Warren Buffett once stated the following:
"I understood, that technical analysis doesn't work, when I flipped price charts “upside down” and got the same result”
The American financier and ex-head of the Fidelity Magellan Fund Peter Lynch criticized the technical analysis no less sharply at one time.:
“The price charts are great, to predict the past "
As opposed to critics, renowned technical analyst George Lane used to repeat the phrase “The trend is your friend!» (“The trend is your friend!»). In his opinion, the main goal of most bidders is to recognize the direction, in which the market moves. Technical analysis tools, Lynch thinks, are designed to recognize the trend and the changes occurring within it.
Criticism about technical analysis is based on attempts to predict price movement. In the same time, the true task of technical analysis tools is to adequately assess the picture of what is happening on the market at the current moment. In this way, TA is usually used as a tool for selecting points of opening and closing trade transactions..
Another argument in defense of TA is that, that a significant number of market participants trust its results, one way or another considering them in their activities. Consequently, since many traders pay attention to these tools at once, between the current behavior of charts and technical indicators, as well as further movements in the price of the asset, there may be a stable causal relationship.
In this way, technical analysis is a method of predicting future price movements by analyzing their past and present movements. On the other hand, as well as the weather forecast, technical analysis cannot predict future prices with 100% accuracy. TA is often used to, to notify investors about, what is most likely to happen in the market in the future.
Technical analysis can organically complement fundamental analysis. Also, you should always remember, that the psychological component is extremely important in exchange trading, which is especially relevant in an environment of increased volatility.
Glossary for the article
Buy&Hold ("Buy and hold") - strategy, assuming the purchase of assets and their long-term retention with the expectation of a significant increase in price.
White Paper (WP) - document, containing basic information about the project, product under development, stages of its creation and timing of market introduction, etc.. d.
Patterns — stable repeating combinations of these prices, volumes or indicators. Also, patterns are sometimes called "patterns" or "patterns" of technical analysis..
Demand - the desire and readiness of the investor / consumer to pay the price for a certain asset / good or service. Other things being equal, asset price increases as demand rises, and vice versa.
Sentence — total number of assets/goods or services, which are available to investors / consumers at a certain price. Other things being equal, with an increase in the supply of a coin on the market, its price decreases, and vice versa.
Bar chart - a series of vertical lines, reflecting price changes over a period of time. Each individual bar reflects four price values: opening, maximum, minimum and close. Along with Japanese candles, the bar chart is also very popular among traders.
Oscillator - TA tool, allowing in the short term to detect overbought or oversold conditions in the market. Often used in conditions of flat movement of the asset price.
Review of popular technical analysis patterns
Graphic shapes (patterns), especially in combination with other technical analysis tools (indicators, oscillators, Fibonacci levels, etc.. d.), can give the trader a good idea of the further most likely scenarios of the asset price movement.
This review will consider the popular trend continuation and reversal patterns., including "Triangle", "Wedge", "Rectangle", "Head and shoulders", "Flag", as well as their varieties.
Trend reversal patterns
As you might guess from the name, we will talk about the figures of technical analysis, signaling that, that the trend is about to change course, and the price is likely to move in the opposite direction.
So, if during an uptrend a reversal looms pattern, then this will hint to the trader about the upcoming trend change from bullish to bearish. And vice versa, if a reversal pattern is formed on a downtrend, then, probably, the trend will change to an upward one just around the corner, providing a good opportunity to open a long position.
double top. This figure of technical analysis (AND) signals an imminent takeover of the initiative by the bears. From the name it is clear, that this figure consists of two consecutive and approximately equal in height tops, between which a hollow is visible.
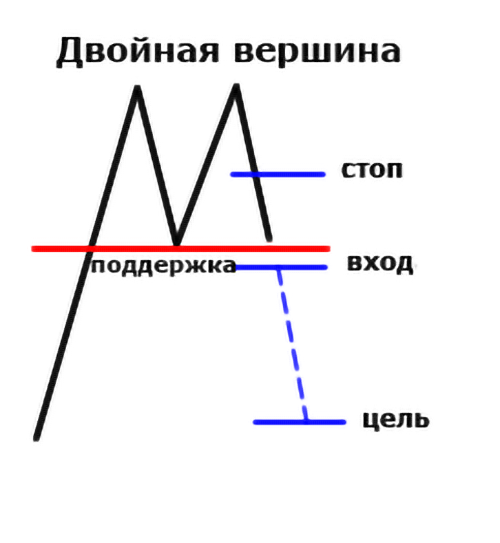
In the diagram above, blue color indicates the reference points for entering a trade., price movement target, as well as the approximate location of the stop loss order for margin trading supporters.
The reliability of this pattern is proportional to the size of the timeframe. In other words, A "double top" on a fifteen minute chart is less reliable, rather than the same figure, formed over days or weeks.
Confirmation of a trend change in this pattern is the price breaking through the support line (highlighted in red).
Basic moments, which should be considered:
- this pattern must be preceded by a steady and prolonged uptrend;
- the tops of the pattern create a resistance level (during their formation, an increase in the trading volume is desirable);
- when a trough is formed, the price reduction should be at least 10% (desirable against the background of a significant decrease in trading volumes); bottom price low forms support level;
- both vertices should be approximately the same height;
- after the formation of the second top, the breakout of the support line should be accompanied by an increase in trading volumes;
- after breaking through the support line becomes resistance;
- the target of the price movement is approximately equal to the distance from the peaks of the tops to the support line;
- vertices should not be too close to each other (the best thing, when the second top is formed about a month after the first).
Head and shoulders. This is another pattern, marking the end of the bullish trend and the beginning of the dominance of bears in the market.
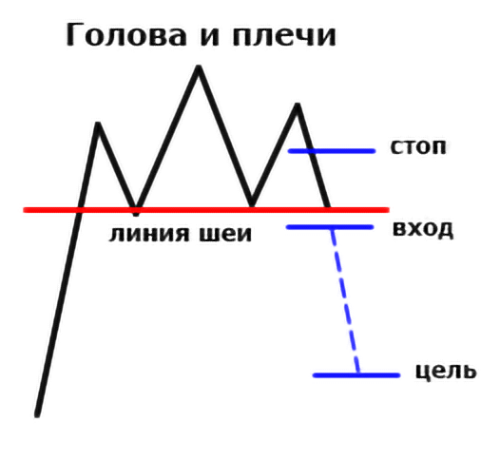
This figure consists of three consecutive peaks:
- middle - head - is the tallest of them;
- lateral (left and right shoulder) approximately equal to each other in height.
Neck line (support) form lows after the first and second peaks.
Other features of the pattern:
- this figure (how, however, any other reversal pattern) must be preceded by a long and steady trend;
- in practice, the neck line is rarely strictly horizontal, therefore, its slight slope is allowed; in this case, the direction of inclination also matters - if it is directed downward, then the bears are more determined, than if the line was tilted slightly upward;
- the confirmation of this figure is the breaking of the neckline, accompanied by an increase in trading volume;
- the approximate target for price movement is the distance between the high of the head and the neckline.
rising wedge. This figure also signals the coming dominance of bears.. Schematically, it looks like this:
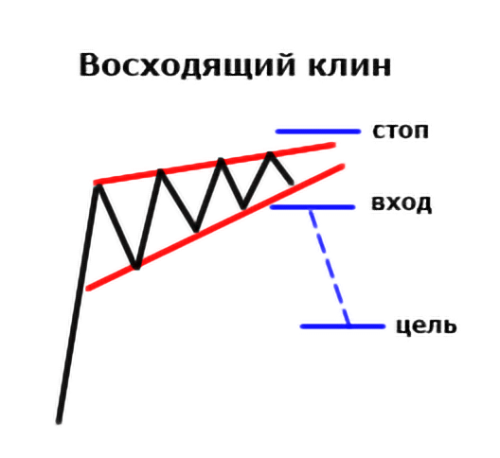
Note, that the "Rising Wedge" can also form on a downtrend. However, in this case, it will represent a trend continuation pattern..
In this way, regardless of the previous trend, Rising Wedge is a bearish pattern. The signal to open a short position is the breakout of the lower support line of this figure.
Features of the pattern:
- the reliability of the figure depends on the duration of the period of its formation (the longer the better);
- the upper resistance line and the lower support line should form a cone, which narrows over time (preferably if consolidation accompanied by a decrease in trading volumes);
- the breakout of the lower wedge line should be accompanied by a surge in trading volumes;
- the goal after working out this pattern is quite difficult to determine (for this you can use additional technical analysis tools, including Fibonacci levels).
Double bottom. This pattern signals a possible reversal of the bearish trend soon. This pattern looks like two consecutive troughs., approximately equal to each other in depth:
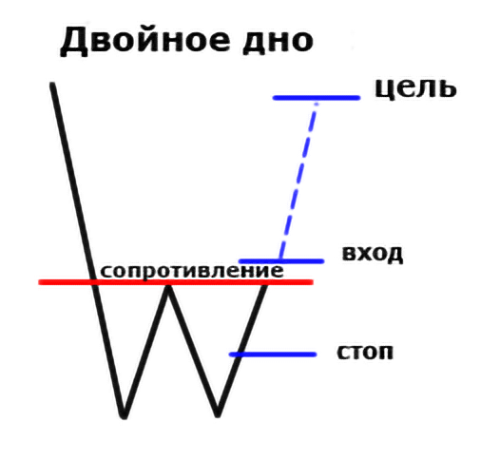
Features of the pattern:
- works reliably on relatively large timeframes;
- the pattern must be preceded by a steady and prolonged downtrend;
- the first bottom is the minimum point of the current trend; its formation should be accompanied by an increase in trading volumes;
- the minimum of the first bottom can play the role of support in the future;
- rise after the first trough must be above the minimum at least, than on 10%; the peak of this rise in the future plays the role of resistance;
- it is desirable that the rise after the first trough is accompanied by a decrease in trading volumes;
- the second depression should be approximately the same depth as the first;
- growth after the second trough should be accompanied by an increase in trading volumes (the appearance of gaps is an additional factor, confirming a radical change in market sentiment);
- breaking the resistance line finally confirms the formation of this TA figure, and it must certainly be accompanied by an increase in trading volume;
- after breaking through resistance, you can open a long position, the target of which is approximately equal to the distance between the lows of the lows and the high between them;
- the formation of a reliable "Double Bottom" pattern takes place over several weeks or even months (Note, that this figure usually takes a little longer to form, than the above "Double Top").
Reversed head and shoulders. This is a pattern, which speaks of the imminent change of the downtrend to an uptrend. As the name implies, this figure is a mirror image of the head and shoulders figure discussed above.
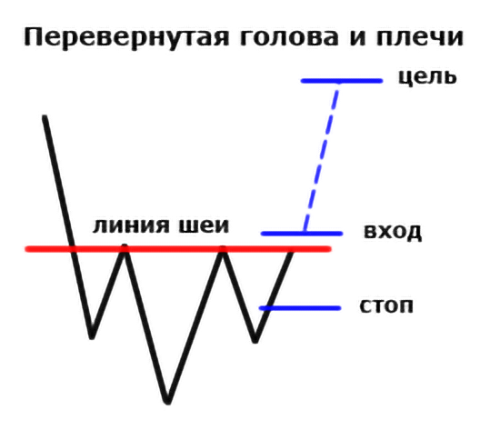
However, there is one difference - "Inverted head and shoulders" is much more dependent on the trading volume..
Features of the figure:
- this pattern should be preceded by a pronounced downtrend;
- extreme depressions (shoulders) should be approximately equal to each other;
- central depression (head) should be the deepest;
- the neck line is formed from two points of correction highs after the formation of the left shoulder and head;
- the neck line may have some slope - if it is directed up, then the mood of the bulls is more decisive;
- the final confirmation of the pattern formation occurs when the neckline is broken, which should be accompanied by an increase in trading volumes (preferably with price gaps);
- after breaking through, the neckline plays the role of a support level;
- the potential for an approximate further price movement is measured by the distance between the price low of the head and the neckline;
- supporters of margin trading can place a stop loss order approximately in the middle of the pattern.
falling wedge. Unlike the "Rising Wedge" discussed above, this TA pattern signals an impending bullish reversal.
This pattern is shaped like a downward-angled cone.:
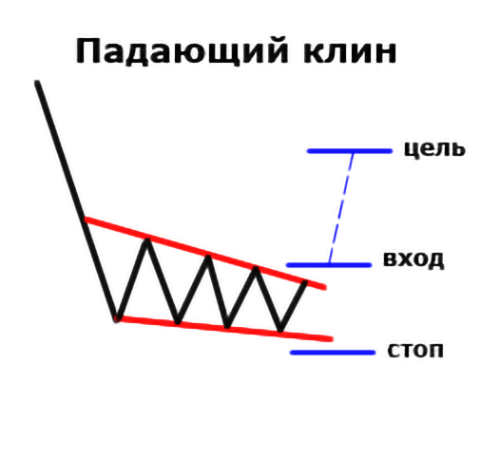
The emergence of a pattern must be preceded by a pronounced downtrend. A price exit upward from a narrowing cone-shaped range gives a buy signal.
Other features of the pattern:
- the reliability of the "Falling wedge" figure directly depends on the duration of its formation (the longer, the more reliable);
- desirable, so that the upper resistance line of this pattern passes through two or three declining corrective highs;
- the lower support line is also built in two, three is better, declining minimums;
- as the range narrows, the strength of the downward movement should gradually fade, testifying to the relief of seller pressure;
- the final confirmation of the pattern occurs when the resistance line is broken, which must be accompanied by an increase in trading volumes.
However, sometimes "Falling wedge" is regarded by analysts as a signal of the continuation of the dominant trend. However, in this case, such a wedge has some specific features.:
- it should form on the ascending, not on a bearish trend;
- the slope of the wedge should be in the opposite direction to the main trend.
Trend Continuation Patterns
As the name suggests, such TA figures signal the continuation of the dominant trend. The most important component of such patterns is the period of consolidation, when the price moves within a relatively narrow or gradually narrowing range.
Against the background of such figures, there is something like a respite in the market. After the price breaks out of the trading range, the trend usually continues..
The trend continuation patterns include some modifications of the triangles., wedges, as well as pennants.
Recall, a wedge can also be viewed as a reversal pattern, and as a trend continuation pattern (depending on the trend preceding this pattern).
So, the picture below shows"Falling wedge", before the formation of which the price was in a bullish trend:
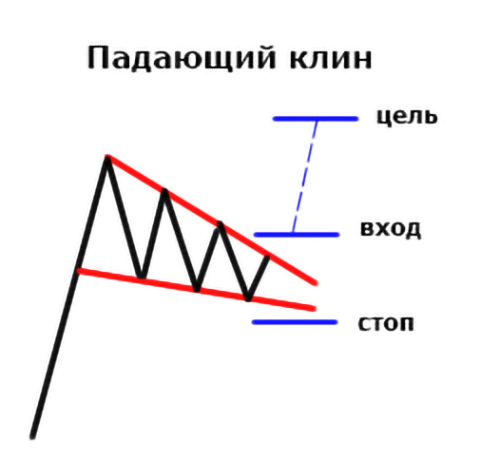
The diagram above shows, as after a period of some "respite" - a corrective movement in a narrowing range - the price breaks out the upper resistance line and resumes an uptrend.
Also, the trend continuation pattern is"Rising Wedge", preceded by a bearish trend:
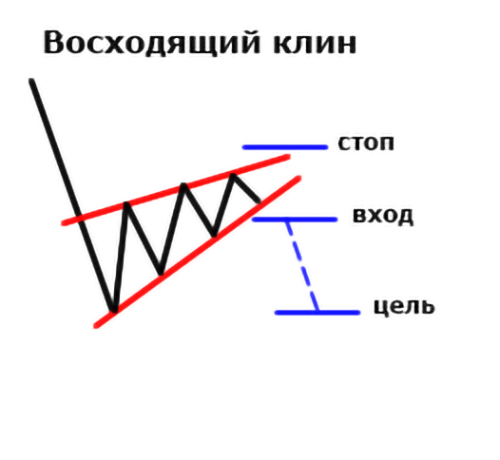 Rectangles are trend continuation patterns. These patterns got their name because, that when they are formed, the price moves within the trading range limited by two horizontal lines, forming a rectangular shape.
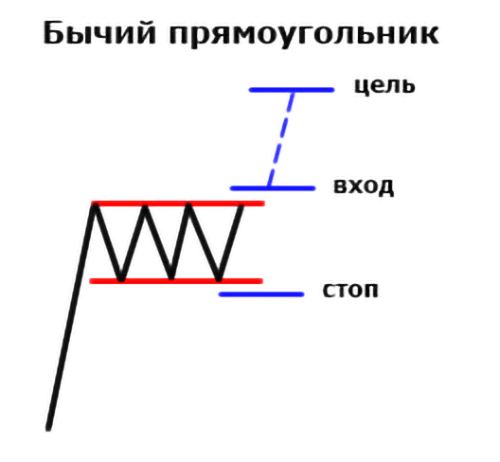
The period of price consolidation within the rectangle forms a series of approximately equal highs and lows.
"Bullish rectangle" indicates the continuation of the uptrend at the end of the consolidation period:
"Bearish rectangle", vice versa, signals the resumption of the downward movement:
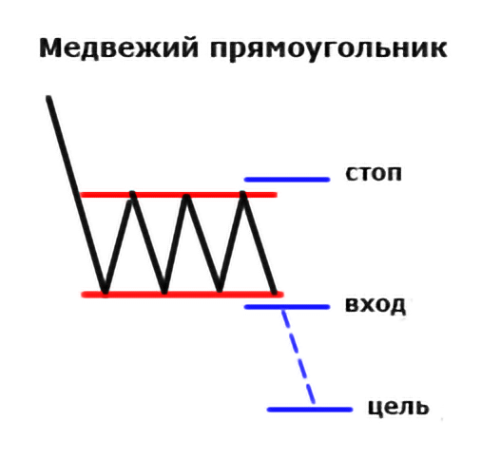
Other features of rectangles:
- the pattern must be preceded by a bullish or bearish trend lasting several weeks to months;
- if the trend preceding the rectangle lasted a very long time, then the probability of a radical change in the trend increases (in other words, sometimes rectangles can also be reversal patterns);
- minima and maxima forming a rectangle should be approximately equal in height;
- if during consolidation there is a decrease in trading volumes - there is a high probability of a bearish trend, and vice versa;
- breaking through the resistance line (exit from the consolidation zone) should be accompanied by a surge in trading volumes;
- the broken resistance level later becomes support for the upcoming price corrections;
- the goal of price movement after exiting the trading range is the distance between the support and resistance levels (i.e, height of the rectangle).
Many supporters of short-term trading place buy orders just above the support level of the rectangle during the price movement in the trading range., and sell orders are just below the resistance line.
Pennant. This is another trend continuation pattern.. Pennant may be bullish (formed during an uptrend):
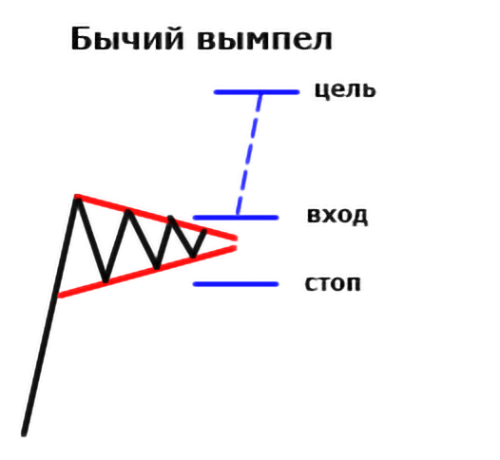
... and bearish (arising against the background of a downtrend):
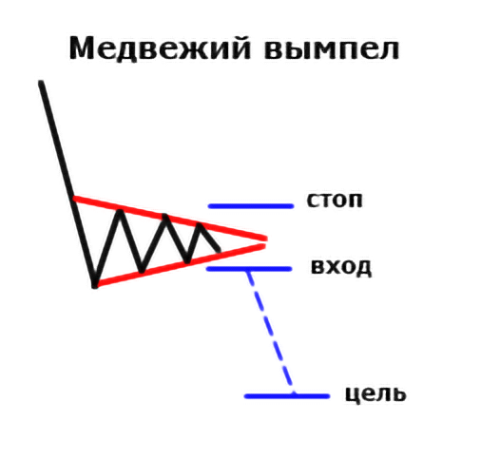
This figure has been forming for a relatively short time.. She, in fact, represents a correction in the context of an actively developing trend.
A trade is usually entered after a breakout of the resistance level.. Distance is often an indicative price target., approximately corresponding to the length of the "flagpole" of the pennant.
Triangles
These figures of technical analysis are distinguished by some "cunning", therefore classified in a separate category. This is related to, that during their formation it is rather difficult to unambiguously determine, in which direction the price impulse will follow - up or down. Among such figures, one can distinguish symmetric, popular among many traders., ascending and descending triangles.
The trend that precedes the formation of the pattern is important.. So, if the uptrend was preceded by a bullish trend, then the trendprobably won't change direction.
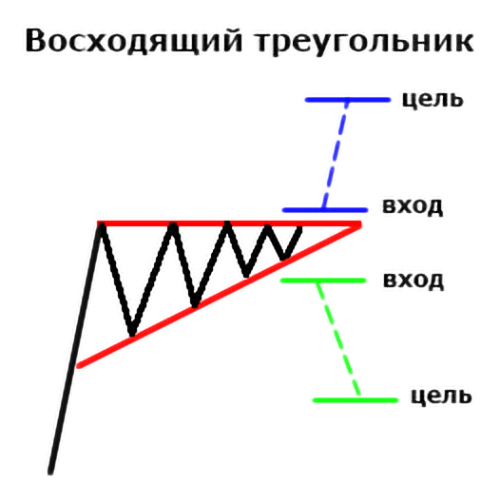
In the diagram above, the blue lines mark the most probable scenario of price movement after the formation of the figure is completed."Ascending triangle". Green - a slightly less likely scenario, which still should not be ruled out.
In this way, in most cases, the Ascending Triangle is viewed by traders as a bullish pattern. The appearance of this pattern usually indicates consolidation before the resumption of the upward price movement.
Other features of this figure:
- the upper resistance level passes through two or more local maximums approximately equal in height;
- the reliability of the pattern increases in proportion to the duration of the previous uptrend;
- the lower resistance line consists of at least two consecutive lows, while each subsequent one must be higher than the previous one;
- often during the formation of this pattern, a decrease in trading volumes occurs;
- the moment of breaking the resistance line should preferably be accompanied by an increase in trading volumes;
- after its penetration, the pattern's resistance line becomes a support line;
- the approximate target of further price movement usually corresponds to the width of the triangle, formed during an upward movement.
"Descending Triangle" often regarded by traders as a bearish pattern:
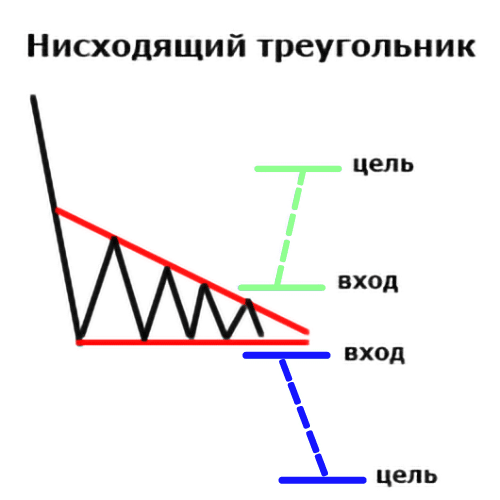
This pattern is forming on a downtrend, in most cases indicating its continuation. In the same time, as seen in the picture above, sometimes when exiting this pattern, the price moves in the opposite direction.
In terms of its features, this figure is similar to the “Ascending triangle” forming on a bullish trend and, in fact, is its mirror image.
"Symmetrical triangle" is relatively neutral:
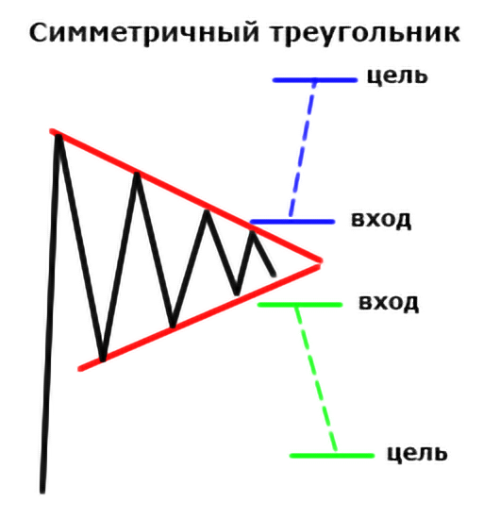
but, for example, if the formation of the "Symmetrical Triangle" was preceded by an uptrend, then this pattern will signal a high probability of continued dominance of bulls in the market.
On the other hand, sometimes the result of the formation of the "Symmetrical Triangle" can be a trend reversal. Consequently, confirmation of the continuation of the trend or its reversal is the direction of breaking through the sides of the triangle.
Other features of the figure:
- the triangle is considered reliable and signaling a high probability of the trend continuation, if the trend lasted for at least several weeks before its formation;
- at least four points are needed to build this figure - two for the resistance line, two more - for support (a more reliable triangle is formed by six points - three for the top line, and three for the bottom);
- as the triangle forms and the range narrows, the trading volume should decrease;
- the approximate target of the price movement is usually determined by the width of the triangle.
Traders should be as careful as possible when dealing with a triangle., especially with symmetrical. Each time such a pattern is formed, two possible price movement scenarios should be taken into account at once..
A source: forklog.com/zanimatelnaya-geometriya-na-rynke-kriptovalyut-obzor-populyarnyh-patternov-tehanaliza/
