Range Bars were developed in the middle 1990- x Brazilian trader and broker Vincent Nicolelis. who for over ten years operated the trading terminal in Sao Paul o. Local markets were very volatile at the time, and Vincent became interested in devising a way to take advantage of volatility. He proceeded from the fact, that price movement was central to understanding and exploiting volatility. He designed Range Bars, to take into account only the price, thus, eliminating from the equation the time. Vincent found, what bars, based only on price, and not taking into account time or other data, provided a new way to view and exploit volatility in markets. Today, Range Bars are gaining popularity as a tool, which traders can use to interpret volatility and place trades on time.
Calculation of range bars
Range Bars only take into account the price, that's why, each bar represents a specified price movement. Most traders are familiar with charts, time-based — for example. 30-minute schedule, where one bar reflects price activity for each 30- minute time period. Time based charts, like a 30 minute chart, will always display the same number of bars during each trading session, regardless of variability, volume or any other factor. Range Bars, On the other hand, can have any number of bars during a trading session. During periods of higher volatility, more bars will be formed, and vice versa — during periods of lower volatility, there will be fewer bars. Number of range bars, formed during the trading session, will also depend on the market instrument and the specified price range of the range bar.
Three rules of range bars:
- everyone range bar must have a maximum / minimum range, which is equal to the given value.
- everyone range bar should open outside the high of the low of the previous bar's range.
- everyone range bar should close. or at its maximum, either at its minimum.
Parameters for range bars
Determining the degree of price movement for the formation range bar not such an easy process. Different trading instruments move differently. For example, higher-ranked stocks (like GOOG) may have a daily range of 7 Dollars, and lower-priced stocks (like RIMM) can move only on 7 cents a day. Common enough, that the instruments with the higher quotation show large average daily price ranges.
The chart shows GOOG and RIMM charts with a range of bars in 10 Cents. For the GOOG market, only half of the trading session (9:30-13:00 EAST) can be compressed, to fit in one screen, since it has a much larger daily range, rather than the RIMM market, where many more range bars can be created 10 Cents.
note, that the GOOG chart has many more bars with a range in 10 Cents, than the RIMM schedule. This is due to the fact, that shares «Google» usually traded in a larger range.
GOOG and RIMM charts represent an example of two market instruments, which are trading at very different prices, which gives different average daily price ranges. It is worth noting, what, although usually more expensive trading instruments have a larger average daily price range, compared to low-priced instruments, markets, having approximately equal quotes, may also have varying levels of variability.
While we could apply the same parameters range bars for similar markets. it is still better to define the appropriate range parameter for each trading instrument. One of the methods for choosing the appropriate parameters is to consider the average daily range of a particular trading instrument.. This can be achieved by simple observation or using special indicators., like Mid True Range (ATR), on the daily chart. Once the average daily range has been determined, a percentage of this range can be used, to set the desired price range for the range bar chart.
Another factor to consider — it's a trading style. Short term traders may be more interested in considering smaller price movements, And. respectively, lean in favor of the lower parameter of the range bar. Long-term traders, vice versa, bar range may be required, based on large price movements. For example, intraday trader can consider the range of the bar in 10 Cents (0.01) for shares «McGraw-Hill Companies» (MNR). This would allow the trader to observe significant price movements., that occur during one trading session. Vice versa, a positional or swing trader may prefer the range bar parameter in 1 dollars (1.0) for the same market. This would allow reflecting price movements., which would be essential for a long-term trading style.
Trading with range bars
Range Bars can help traders to consider the price in «consolidated» form. Most of the market noise, which happens, when prices fluctuate up and down in a narrow range, can be reduced to just one or two bars. This is due to the fact, that a new bar will not be formed, until the full specified price range has been met. This helps traders to distinguish between, what actually happens to the price. Since the range bars eliminate most of the noise, they are very useful for plotting trend lines. Support and resistance areas can be highlighted through the application of horizontal trend lines. Trend periods can be highlighted using up and down trend lines.
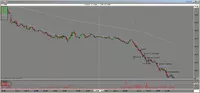
In the diagram 2 showing trend lines, applied to the chart of bars with a range in 0.001 (10 points) for the EUR USD currency pair. Horizontal trend lines easily reflect trading ranges, and price breakouts through these areas are often accompanied by rather powerful movements. Usually, the more time the price fluctuates within the range, the more powerful the movement can be, as soon as the price breakout occurs. This is also true for price touches of uptrend and downtrend lines. — the more often the price touches the trend line, the greater the potential movement after the breakout.
In the diagram 3 the price channel is shown, plotted by two parallel downtrend lines on a GOOG range bar chart. Here we have used range bars 1.0 (every bar equals 1$ price movement), which allows to eliminate «superfluous» price movements, which were observed in the diagram 1, where was used the range of bars in 10 Cents. Since part of the price movement is eliminated due to the larger parameter of the range bar, traders can better identify changes in price activity. Trendlines work well for range bar charts, as with less market noise, identifying trends is much easier.
Interpreting variability
Volatility refers to the degree of price movement of a trading instrument. While the price is holding in a narrow range, fewer range bars, reflecting reduced variability. To the extent, how the price starts to move out of the trading range with increasing volatility, more range bars will be formed. To make a range bar chart an effective tool for measuring volatility, the trader must observe a specific market for a while using different bar ranges. Through such careful observation, the trader may notice subtle changes in bar timing and frequency, with which they are formed. The faster the bars are created, the higher the price volatility — with slower bar formation, lower variability. Periods of increased volatility often carry trading opportunities, as a new trend may begin.
Conclusion
While range bars do not belong to common technical indicators, they are useful tool, which traders can use to identify trends and interpret volatility. Since range bars only take into account price, not time or other factors, they provide traders with a new perspective on price dynamics. A thorough study of range bars in action will allow you to establish the most optimal parameters for each specific trading instrument and trading style., and effectively apply them in your trade.
A source: Forex Magazine.
Copyright © 2011, Nysetrader.net- blog about stock trading in the US stock market.
All rights reserved. |
Permalink |
Comments (1): 1
You can also familiarize yourself with other materials of the section Teaching.
Feed enhanced by from