Support and resistance levels can also be determined уровнями пивот (pivot points). These levels are also a very powerful tool in defining zones. “increased interest” from the side of bulls and bears.
Как рассчитываются уровни поддержки и сопротивления pivot points?
There are many calculation options уровней пивот. Но самый распространенный это стандартный метод расчета pivot points. The prices of the previous day are taken High, Low и Close. The calculation formula is simple:
R2 = P + (H – L) = P + (R1 – S1)
R1 = (P x 2) – L
P = (H + L + C) / 3
S1 = (P x 2) – H
S2 = P – (H – L) = P – (R1 – S1)
In this case “S” – this resistance levels (support), and “R” – support levels (resist). High, Low и Close – this “H”, “L” And “C” respectively.
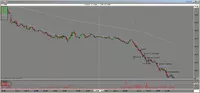
Take a look at an example of a JPM stock, how well she fought off support and resistance levels, сформированных pivot points.
There is also an option for calculating pivot levels taking into account today's open price (today’s opening price):
| P = ((Today’s O) + Yesterday’s (H + L + C)) / 4 |
And support and resistance levels (S1, S2, R1, R2) в данном случае рассчитываются так же как и в первом варианте, only taking into account “modified” пивота (“P”).
How to use support and resistance pivot points?
Pivot level (“P”) itself is a strong support and resistance level and usually strong movements start from this level. S1 levels, S2 и R1, R2 are less influential, but also very strong and very often good movements come from them.
There are several options for using pivot levels.
First as a definition of a short-term trend. If the price is above the pivot level, then the market is bullish. If the price is below the pivot level, then the trend is bearish.
The second use case as points of entry into the market. Trader can place an order to open a position on the breakdown of the support or resistance level. It is also possible to work on a hang-up (this at “боковом” Market). Support and resistance pivot points are good points, for which you can place your stop loss orders.
In conclusion, it should be said, that the level itself cannot yet give a 100% signal. It is very important to use any level with additional signals, such as price action signals, candlestick formations, continuation or reversal chart patterns, as well as indicator signals.
The more factors will speak “FOR”, the higher the chance of a successful deal.