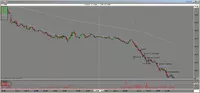
There is a good backtester for options in the terminal Thinkorswim. There is no need to download any data on the prices of stock options and futures, since all this is already several years deep. Just rewind the date back and buy / sell options as if opening positions in real life. Schedule profitability is drawn as a yellow line directly in the chart window with a scale on the left. Very convenient and intuitive.
Here, for example, tested the trend-following strategy on ADBE stocks in the form of selling puts with a strike on the money. If we were just buying stocks, then buy them 27 October 2014 years and would keep them until 5 February 2016 of the year — shown as a dashed white line. But instead of shares, we sell puts and hold them until their price approaches zero.. Then, we immediately buy them off and sell the bonds of the next months, collecting awards. The chronology of sales / purchases is shown in the middle of the picture in colored bars. It can be seen that they were switching to other contracts (rolled) 6 once. And finally closed the position 5 February 2016 years with a profit $475. If only they held 100 Shares, then the profit would be $1200. Probably, this difference is related to the delta, since when selling puts, the delta ranged from about 35 to 45.
Any combination can be tested — straddle, butterflies, condors … anything and how you want to control the position — everything will be reflected in the yield graph.
Pity, certainly, that all this must be done manually for each instrument separately. I.e, you cannot immediately take a portfolio from 1000 stocks and tested over the years 10. But for general education and understanding of options, it's very good..