technology

Patternism.

[info]pratrader started useful, in my opinion, a business, with the publication of technical puzzle patterns. From my side, I want to support the initiative, and deepen it a little. Ie. besides the pattern examples themselves, I will give a graphical structure and description. Why am I doing this? Systematization. Identification of possible errors and consideration of special cases. Discussion. Someone just might be useful. All parties benefit from the discussion. so, let's begin.


In frendlente saw, that many yawned a powerful corrective movement, although they were waiting for him. How to recognize its beginning, and where to start preparing?

73.38 KB

131.69 KB

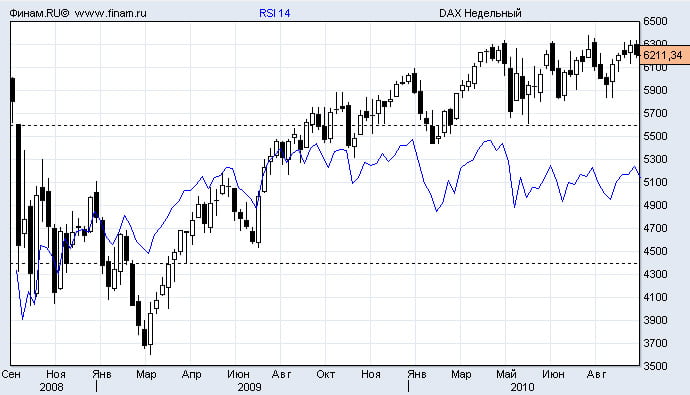
The pattern works in a bull market, in areas of strong overbought. realization, often happens on the news.

32.67 KB

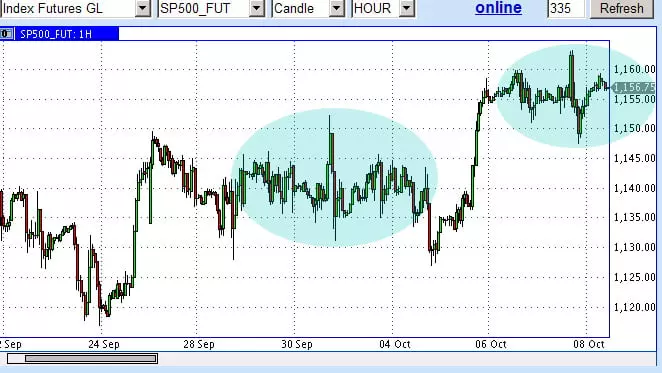
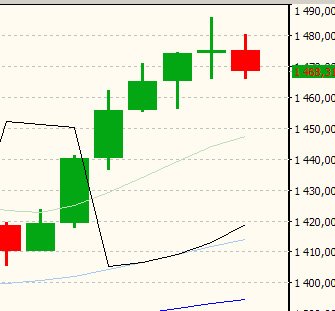
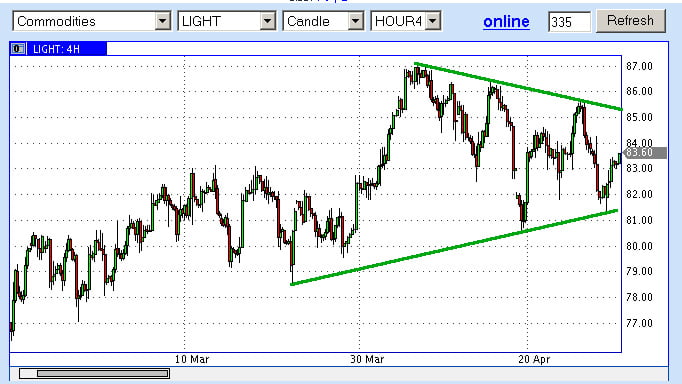
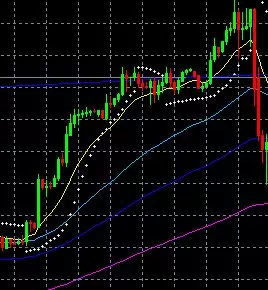
Usually has five (A-C), less often, seven-phase (D) Structure. In the first phase, there is a rapid ejection from a narrow range or a sluggish corrective movement, a kind of impulse. Often coincides with the lower boundary of an ascending channel or the 200th moving average. Second phase – flag correction, sometimes happens horizontally (B) or tilted up (With). Phase three – new impulse up. More often it is weaker than the first. Fourth phase – ascending, fading upward movement, sometimes with a final take-out candle. Important note – this movement should be exactly co-directional, otherwise we are dealing with either a 7-wave figure, or with something else. Fifth (or seventh) – the tastiest – the ability to make money quickly. Actually the bummer itself, start commit. You need to enter on the breakout of the parabolic or the absorption of the last bullish candle. You can set a signal or pending. Profit / loss ratio – Good, usually 1 to 2, 1 to 3. Profit taking on supports – it can be moving averages (100-200 period) better step by step, channel boundary, or at the starting point of the pattern implementation. A small position can be left, on occasion, if there was a trend reversal.

It's been a long time since I picked up checkers…

… haven't been so bearish about markets in a while. Why?

It is sometimes helpful to look a little further than your own nose., therefore, we will build on weekly charts.
Немного слов, quite enough pictures.
Let's start with Europe.

105.70 KB

Loved by many DAX. Trades in a rather narrow range, from which it cannot get out in any way. After “hanged man” на прошлой неделе, a bearish engulfing candlestick formed on this one. You will have to try very hard to neutralize the negative..

111.34 KB

France. Almost a carbon copy of the Germans, with one “but” Clearly visible “inverted flag”, pattern implementation, may well lead us to the level 3000.

103.58 KB

English Footsie 100. Looks a little better. Traded at the resistance, the goal for the hike up is limited. A candlestick pattern has formed “doji”, what is hinting.

The americans.

100.87 KB

After explosive growth and it would seem, Inverted GiPa resistance breakdown, hesitant trampling. As a result – “doji”.

Commodities and emerging markets.

105.64 KB

Australia. Breaking through the neck line of an inverted GiP, the price was unable to gain a foothold above.

102.90 KB

On the day, the negative is seen more clearly. To overcome it, a powerful upward movement is needed in the coming days. Otherwise “ouch”.

101.39 KB

Indian market, breaking through the ascending channel, grew steadily within a month, reaching the target zone. As a result, we have a certain similarity “hanged man”. What happens with such RSI values ​​on weekly charts, no need to speak. Correction, possibly to the area 1850.

105.26 KB

Brazil looks confident. The price is moving in an upward channel, but on closer examination, we see all the same “inverted flag” and the proximity of a powerful zone of resistance. Nevertheless, growth next week is quite possible here.

I did not give a picture for China – everything is very narrow and vague there, in my opinion. Now back to our rams.

102.62 KB

MICEX. The index grows sluggishly within the limits “inverted pennant” Exit in such cases, usually going down, plus formed “hanged”. Divergence by RSI. To improve the situation, a powerful upward throw is required, with fastening. Sberbank alone is clearly not enough for this..

100.93 KB

Sber. Arranged for all shorts “Kuzkin's mother” this week. However, the upward movement on it is limited by powerful resistance., and pattern boundaries (again this inverted flag). The only thing, what can make me throw my shorts over it, this is consolidation above the highs of the year.

100.35 KB

The monthly chart shows, that the exit can take place as a retest of the absolute maximums, and correction for 65-70, а может и 40, Who knows. Я сильно сомневаюсь, that with a general correction, Sberbank will go higher. That's why, so as not to call RBC with a question:”I bought Sberbank for 90 р., so what's now?!”, I would refrain from shopping now, pending clarification, so to speak :)

I will not write about Gold, there the correction is not just ripe… :) For Eurodollar View here http://maxim-pr.livejournal.com/164264.html

98.39 KB

Oil (Brent). Powerfully shot up, closing above resistance. Seems, from the campaign of 90 nothing holds us back. Only a virtual obstacle remains, as a channel boundary. В Россию, Consequently, send money,(Really, nobody buys something in the oil industry, why, interesting?). Think, next week will clarify a lot.

so.

After all, we went beyond the boundaries of the descending channel, albeit with a creak. A quick glance at the days suggests, that three green candles will be drawn, which coincides in time, with the end of the quarter. The price on the watch is higher 200 EMA, which is also positive. Target – range 142000-143000 по Ri, there passes and 61.8 Fiba. Understandably, that we will fly in a straight line, I think, in the near future, we won't see strong movements. Probably it's for the best :)

Another “crucial moment”?

If we abstract from the external background and look technically, it is seen, that we are close to a very important point.


Bull horror story :)

In general, you can see everything from the graphs.. Called, find 3 differences between A and B. Goal first, we can say reached (not expected, that they will be drained so quickly, thought calmly, in the channel, хе-хе…http://maxim-pr.livejournal.com/132441.html) Now it's logical, if there are a couple of correction days, especially friday, and to conquer new loys. Who dreamed of shopping for 1300 on the MICEX, be patient, left just a little bit…

UPD. While writing – the goal has already been exceeded.

Dreaming… whether big, or small…

Interesting, to me alone GiP by S&P500 is dreaming? Very clearly visible at 4H. Archival level – 1180. If we leave below, correction then 1155 practically provided. Such is the Bear :) It would even be very good for the markets, but maybe again, everyone will redeem :)

Light oil.

By oil, a triangle is drawn. It will be logical, if we get to 85, and this will coincide with the target set yesterday for the RTS futures. But where next? Might be right, this time Demura, and let's go to 95? :)


Scroll to Top