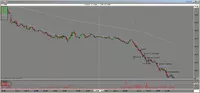
5 minutes :
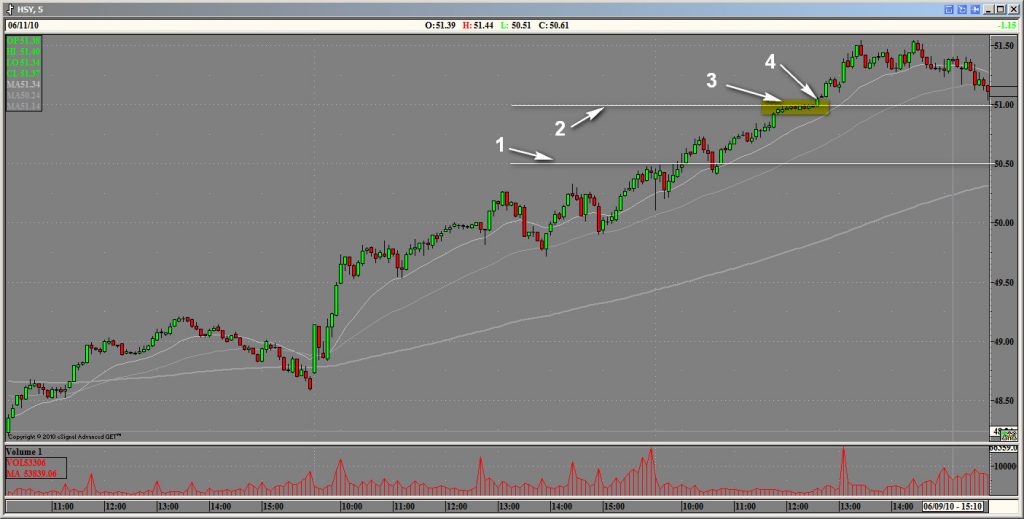
15 minutes :
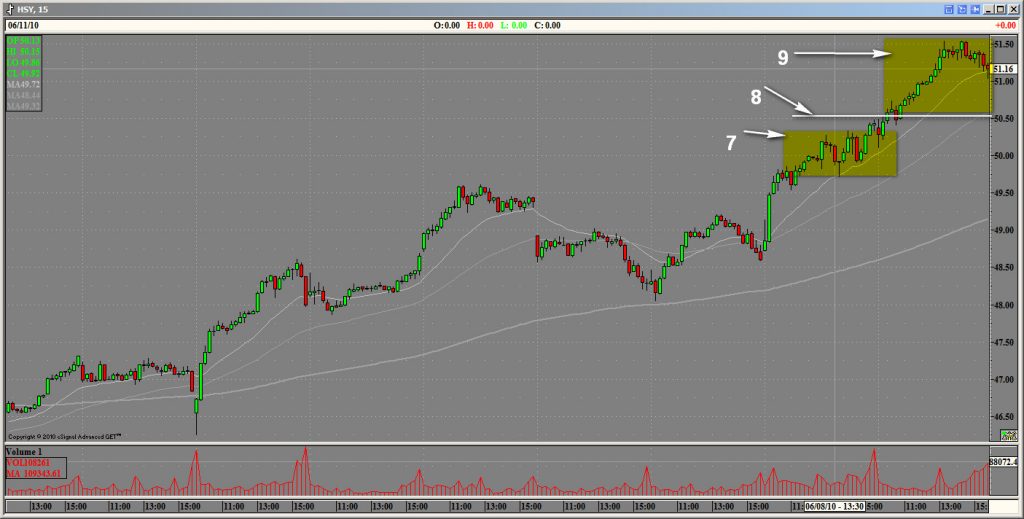
Day schedule :

Share is trading above the annual high and there is a good chance that the uptrend will continue. On average, she doesn't walk very much., but on good days it can pass 100C or more. There are no levels nearby.
1. Yesterday's level
2. Today's temporary level, where a rollback and further trend continuation is possible
3. Consolidation at the level before overcoming it or rolling it back, a good place to take a small position in advance before overcoming the level with minimal risk
4. Overcoming the level that should become support in case of a possible rollback and a place where you can increase the position with little risk
5. The daily chart shows that the stock is going steadily up, but in this area she stood in the corridor, to overcome which it may continue to move up
6. The stock overcame its previous high and closed at the very top, if the next day it passes it there are great chances for the trend to continue up
7. Small corridor, in which it was determined whether the stock will go up or roll back down again
8. The same as the first item on a larger time interval, but for some reason his action broke through, although I should have repelled
9. Almost perfect upward movement