Public Storage (NYSE: PSA) — fund, nesting in storage rooms. This is a measured and well-developed business. The only inconsistency for him may be an increase in rates in the United States..
What happens here
Readers have been asking us for a long time to start sorting out the financial statements and business foundations of foreign issuers.. The idea to review Public Storage was suggested by our reader Ingvar Pchelyakov in the comments to the Hologic review.. Offer in the comments of the company, analysis of which you would like to read.
The overview contains many screenshots with tables from reports. To make it more convenient to use them, we transferred them to google-sheets and translated into Russian. Direct your attention: there are several sheets. And keep in mind, that companies round off certain numbers in documents, therefore, the totals in graphs and tables may not converge.
Download the table from the report
What do they earn
The company belongs to REIT funds, managing?? real estate and a huge part of the income should be distributed among the owners of shares.
The company manages a complex of storage facilities. If you have watched Breaking Bad, you understand, how does such a room look.
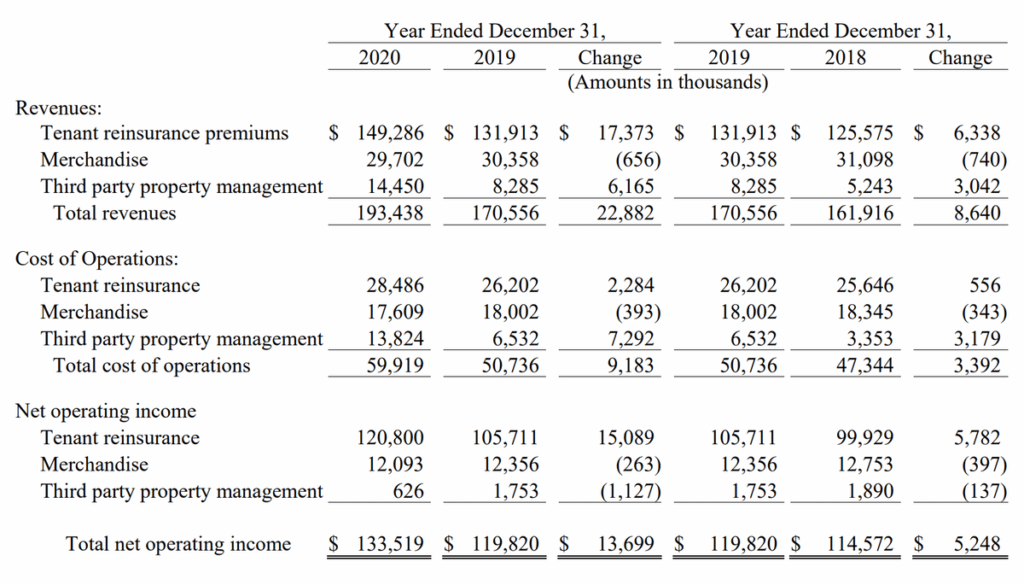
The company's revenue is divided into two unequal parts.
Storage — 93,37 %. This, actually, rent for the introduction of company premises by clients to store their own belongings. The sector's operating margin is 70,31 % from its proceeds.
Accompanying services — 6,63 %. The sector's operating margin is 69,43 % from its proceeds. Here, the company's revenue is divided into subsequent segments.:
- Reinsurance services — 77,17 % subsegment revenue. Here, customers pay the company payments for the insurance of things stored by it.. The insurer is another company, Public Storage acts as an intermediary. Subsegment operating margin — 80,91 % from its proceeds.
- Selling products - 15,35 % subsegment revenue. These are implementations of pieces, which are necessary for the owners of things stored in the premises: locks, boxes and all, what is needed for packing. Subsegment operating margin — 40,71 % from its proceeds.
- Management of real estate objects of other companies — 7,48 % subsegment revenue. Subsegment operating margin — 4,33 % from its proceeds.
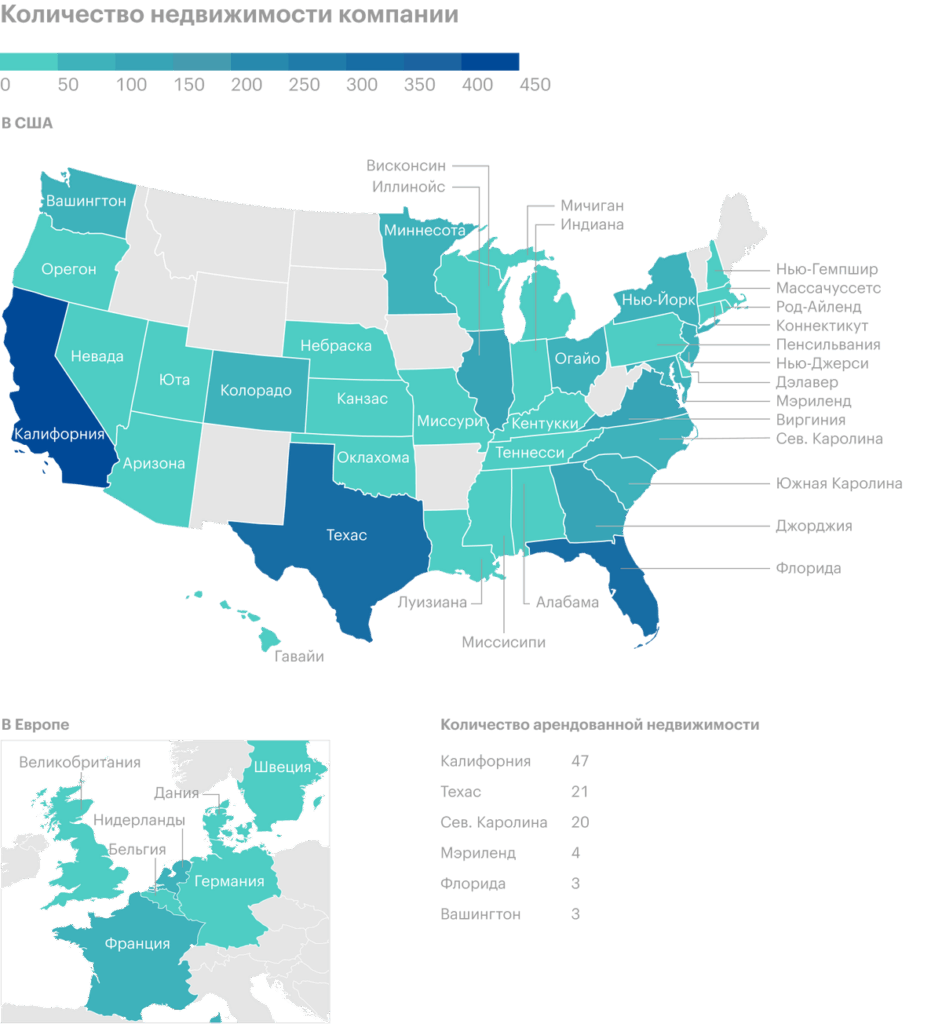
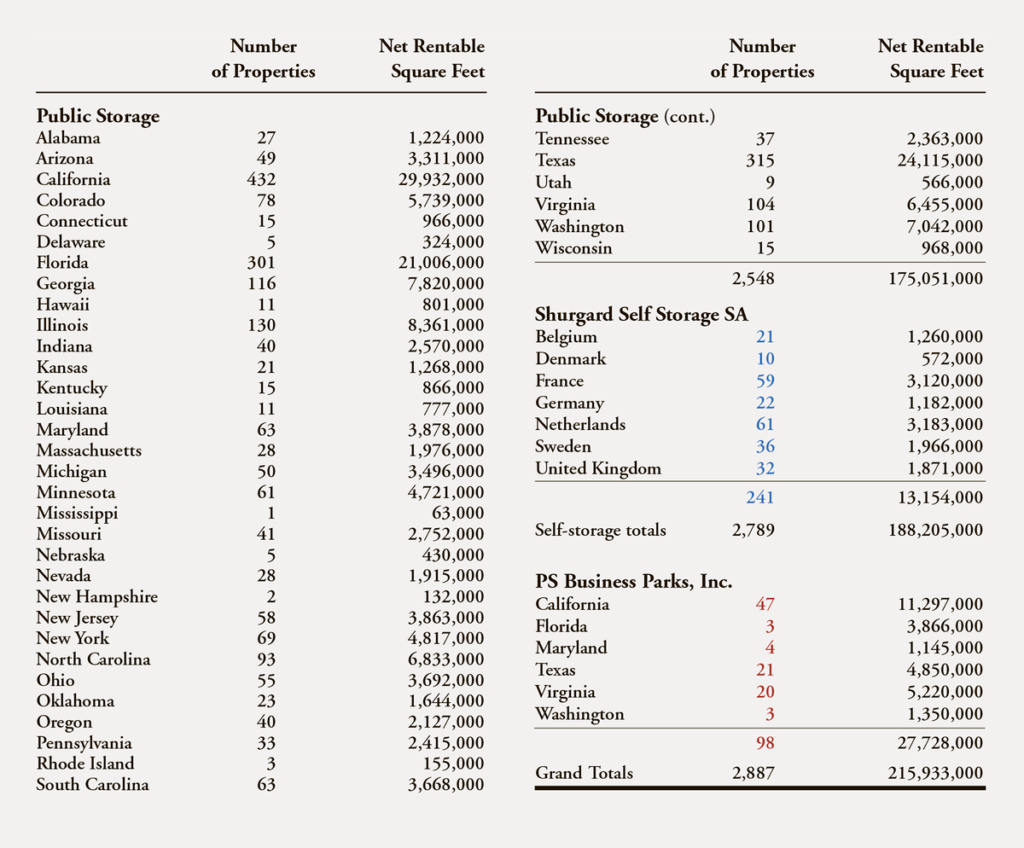
The company earns its main funds in the USA, however, she has assets in other states.



Annual revenue and profit of the company, billion dollars
| Revenue | Profit | Profit Margin | |
|---|---|---|---|
| 2017 | 2,67 | 1,42 | 53,21% |
| 2018 | 2,75 | 1,60 | 58,04% |
| 2019 | 2,85 | 1,40 | 49,04% |
| 2020 | 2,92 | 1,21 | 41,54% |
Revenue
2017
2,67
2018
2,75
2019
2,85
2020
2,92
Profit
2017
1,42
2018
1,60
2019
1,40
2020
1,21
Profit Margin
2017
53,21%
2018
58,04%
2019
49,04%
2020
41,54%
Reading between reporting lines
The U.S. storage market is approximately $40.73 billion a year.. Public Storage takes up not even half of it, but it costs much more - 51.7 billion. This makes one think about, that the company is disproportionately expensive.
The dividend yield of these stocks has been treading water for years.: since 2017, shareholders receive 8 $ per share per year, what constitutes 2,7% per annum.
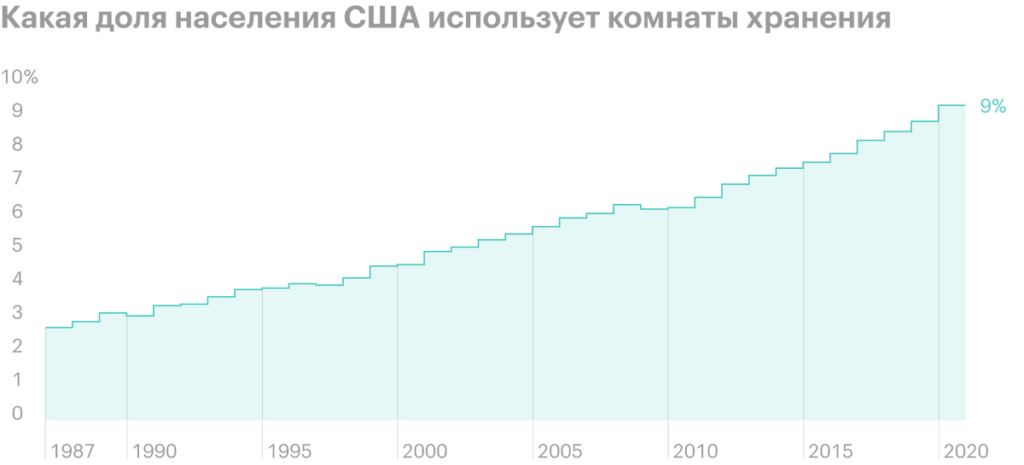
On the other hand, This yield is very good by today's standards.. And most importantly - it is stable, because it is a marginal and sustainable business. The market dynamics are positive here.: percentage of Americans, using the services of storage services, growing slowly.
The company is making the most of its premises. Plus, she has a fairly diversified portfolio of assets.. And in terms of a huge number of parameters, Public Storage is ahead of most of its competitors.. Actually, the fund's dividend yield is treading water precisely because, that the company was actively spending on business expansion. So for a long-term investment, Public Storage can be a very good option..
Storage market in the USA by number of sq.. feet for each company
| Public Storage | 9,4% |
| Extra Space Storage | 4,6% |
| Life Storage | 2,6% |
| National Storage Affiliate | 2,5% |
| CubeSmart | 2,0% |
| Rest of the market | 79,0% |
Public Storage
9,4%
Extra Space Storage
4,6%
Life Storage
2,6%
National Storage Affiliate
2,5%
CubeSmart
2,0%
Rest of the market
79,0%
Company performance in different quarters
| Share of employed sq.. feet | Rent per sq. foot per year, Dollars | |
|---|---|---|
| March 2020 | 92,7% | 17,88 |
| May 2020 | 94,0% | 17,42 |
| March 2021 | 96,0% | 18,06 |
| May 2021 | 96,5% | 18,54 |
Share of employed sq. feet
March 2020
92,7%
May 2020
94,0%
March 2021
96,0%
May 2021
96,5%
Rent per sq. foot per year, Dollars
March 2020
17,88
May 2020
17,42
March 2021
18,06
May 2021
18,54
Comparison of the growth in space of different companies, million sq. feet
| For 15 years | For 10 years | For 2 of the year | |
|---|---|---|---|
| Public Storage | 90 | 52 | 20 |
| Extra Space Storage | 52 | 42 | 6 |
| Life Storage | 32 | 21 | 2 |
| CubeSmart | 18 | 15 | 4 |
| National Storage Affiliates | — | — | 9 |
Public Storage
For 15 years
90
For 10 years
52
For 2 of the year
20
Extra Space Storage
For 15 years
52
For 10 years
42
For 2 of the year
6
Life Storage
For 15 years
32
For 10 years
21
For 2 of the year
2
CubeSmart
For 15 years
18
For 10 years
15
For 2 of the year
4
National Storage Affiliates
For 15 years
—
For 10 years
—
For 2 of the year
9
Revenue per sq.. feet from different companies by region in dollars
| Public Storage | Extra Space Storage | Life Storage | |
|---|---|---|---|
| Los Angeles — Riverside — Orange Country, THAT | 25,99 | 21,59 | 21,49 |
| San Francisco —Oakland — San Jose, THAT | 26,39 | 27,43 | — |
| New York — New Jersey — Long Island, NEW, NJ, PA | 25,67 | 23,78 | 22,80 |
| Seattle — Tacoma, WA | 19,40 | — | — |
| Washington — Baltimore, DC, MD, will, WV | 20,03 | 18,38 | — |
| Miami — Fort Lauderdale, FL | 19,65 | 17,91 | 17,87 |
| Chicago — Gary — Kenosha, The, IN, WI | 14,78 | 14,75 | 14,44 |
| Atlanta, GA | 12,89 | 12,30 | 12,33 |
| Dallas — Fort Worth, TX | 12,97 | 11,81 | 12,10 |
| Houston — Galveston — Brazoria, TX | 12,06 | 11,73 | 11,89 |
| Orlando, FL | 13,40 | 13,12 | 11,75 |
| Philadelphia —Wilmington — Atlantic City, PA, FROM, NJ | 17,14 | 16,00 | — |
| West Palm Beach, FL | 18,08 | — | — |
| Tampa — St.Petersburg, Clearwater, FL | 13,59 | 15,98 | 14,35 |
| Charlotte, NC | 10,55 | — | 11,86 |
Los Angele — Riverside — Orange Country, THAT
Public Storage
25,99
Extra Space Storage
21,59
Life Storage
21,49
San Francisco — Oakland — San Jose, THAT
Public Storage
26,39
Extra Space Storage
27,43
Life Storage
—
New York — New Jersey — Long Island, NEW, NJ, PA
Public Storage
25,67
Extra Space Storage
23,78
Life Storage
22,80
Seattle — Tacoma, WA
Public Storage
19,40
Extra Space Storage
—
Life Storage
—
Washington — Baltimore, DC, MD, will, WV
Public Storage
20,03
Extra Space Storage
18,38
Life Storage
—
Miami — Fort Lauderdale, FL
Public Storage
19,65
Extra Space Storage
17,91
Life Storage
17,87
Chicago — Gary — Kenosha, The, IN, WI
Public Storage
14,78
Extra Space Storage
14,75
Life Storage
14,44
Atlanta, GA
Public Storage
12,89
Extra Space Storage
12,30
Life Storage
12,33
Dallas — Fort Worth, TX
Public Storage
12,97
Extra Space Storage
11,81
Life Storage
12,10
Houston — Galveston — Brazoria, TX
Public Storage
12,06
Extra Space Storage
11,73
Life Storage
11,89
Orlando, FL
Public Storage
13,40
Extra Space Storage
13,12
Life Storage
11,75
Philadelphia — Wilmington — Atlantic City, PA, FROM, NJ
Public Storage
17,14
Extra Space Storage
16,00
Life Storage
—
West Palm Beach, FL
Public Storage
18,08
Extra Space Storage
—
Life Storage
—
Tampa — St.Petersburg, Clearwater, FL
Public Storage
13,59
Extra Space Storage
15,98
Life Storage
14,35
Charlotte, NC
Public Storage
10,55
Extra Space Storage
—
Life Storage
11,86
Operating margin of various companies as a percentage of revenue
| Public Storage | 75,9% |
| Extra Space Storage | 71,3% |
| National Storage Affiliates | 70,5% |
| CubeSmart | 70,1% |
| Life Storage | 66,8% |
Public Storage
75,9%
Extra Space Storage
71,3%
National Storage Affiliates
70,5%
CubeSmart
70,1%
Life Storage
66,8%
Comparing Public Storage to industry averages
| Public Storage | Industry averages | |
|---|---|---|
| Revenue per sq.. feet, Dollars | 16,40 | 14,05 |
| Operating income per square meter. feet, Dollars | 12,86 | 10,20 |
| Operating margin, percent of revenue | 76% | 70% |
Revenue per sq. feet, Dollars
Public Storage
16,40
Industry averages
14,05
Operating profit per sq. feet, Dollars
Public Storage
12,86
Industry averages
10,20
Operating margin, percent of revenue
Public Storage
76%
Industry averages
70%
The ratio of enterprise value to the consensus estimate of EBITDA for different companies
| Life Storage | 23,5X |
| CubeSmart | 24,4X |
| Public Storage | 24,7X |
| Extra Space | 26,2X |
| National Storage Affiliates | 29,2X |
Life Storage
23,5X
CubeSmart
24,4X
Public Storage
24,7X
Extra Space
26,2X
National Storage Affiliates
29,2X
ESG buns
The company is quite diligent and not without success positioning itself as a very progressive and environmentally friendly. This is a big bonus in our troubled times., when ethical-minded investors can start investing in these stocks because of the combination of reasonably attractive passive returns and following a progressive agenda.
Company employees, belonging to a specific group of the population
| Women | 69% |
| Women managers | 39% |
| Colored | 52% |
| Color managers | 32% |
| Generation X | 35% |
| Millennials | 40% |
| Generation Z | 15% |
| Boomers | 10% |
Women
69%
Women managers
39%
Colored
52%
Color managers
32%
Generation X
35%
Millennials
40%
Generation Z
15%
Boomers
10%
The environmental impact of the company's work
| Public Storage | Average performance of competitors | Percentage difference between companies | |
|---|---|---|---|
| Power consumption, kWh per sq. foot | 1,7515 | 14,0604 | −88% |
| Air emissions, million tons of CO2 equivalent per sq.. foot | 0,0006 | 0,0055 | −89% |
| Water consumption, kilogallons per square meter. foot | 0,0016 | 0,0262 | −94% |
| Waste, metrich. tons per sq.. foot | 0,0001 | 0,0007 | −86% |
Power consumption, kWh per sq. foot
Public Storage
1,7515
Average performance of competitors
14,0604
Percentage difference between companies
−88%
Air emissions, million tonnes of CO2 equivalent per sq. foot
Public Storage
0,0006
Average performance of competitors
0,0055
Percentage difference between companies
−89%
Water consumption, kilogallons per sq. foot
Public Storage
0,0016
Average performance of competitors
0,0262
Percentage difference between companies
−94%
Waste, metric tons per sq. foot
Public Storage
0,0001
Average performance of competitors
0,0007
Percentage difference between companies
−86%
Inflationary matters
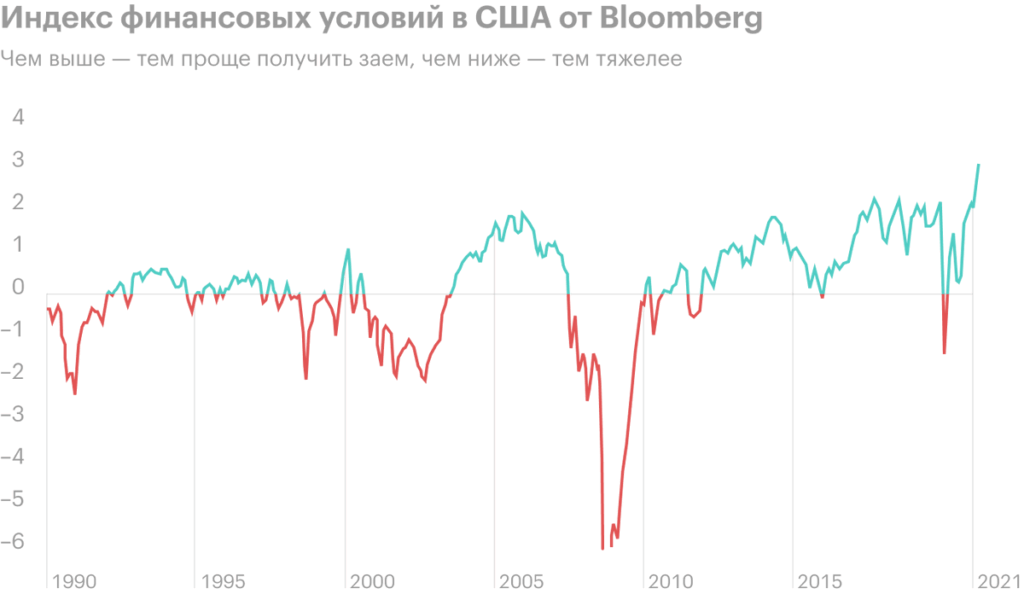
In the US, the time has come, when FED it's time to raise the key rate: inflation in the country has already risen. This can be a problem for a company for two reasons..
First: like many REITs, Public Storage is actively borrowing money. The total amount of the company's debts is 3.364 billion dollars with 159.6 million in the accounts. The growth of rates is equal to the rise in the cost of loans. US lending conditions are now extremely soft, and therefore any movement in the opposite direction is definitely not a plus for companies, who actively borrow money.
The second reason: rising rates will lead to an increase in bond yields. In this regard, the profitability 2,7% Public storage will look less attractive in the eyes of investors. So in this case, Public Storage shares may fall due to the exodus of passive income lovers into higher-yielding stocks.. Good news: no one has announced a rate hike yet, but it could come at any moment.
Resume
Public Storage is an interesting issuer, which shares can be taken, if you really want, "To make money work". However, problems should be kept in mind., which the company may face in the event of an increase in rates.
