During periods of rising inflation, like now, certain stocks can outperform the market. Potential Winners – Companies, who have the opportunity to raise prices for their goods and services.
Two recent inflationary periods - from November 2003 years to September 2006 year and from October 2010 years to January 2012 of the year. Then the average annual return S&P 500 amounted to 9%.
Which companies benefit from inflation? CNBC selected stocks with better dynamics than the market during periods of inflationary growth. The list includes companies, who recommend more than 70% Analysts, and their growth potential is at least 10% from the target price.
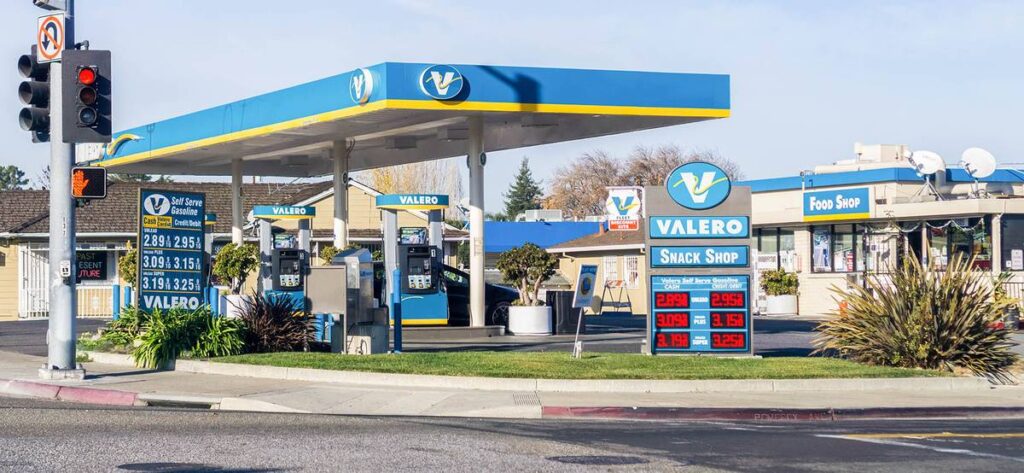
Oil refining company Valero Energy is recommended to buy 84% Analysts. Since the beginning of the year, its shares have risen in price by 51%, a index S&P 500 during the same time added 14%. Credit Suisse believes, that the company's stock will continue to rise as fuel demand recovers.
Another company, which grows better than the market during inflation – Cigna. This year, the shares of the insurer have added 24%. Citi Celebrates Cash Flow and Attractive Company Valuation: P / E — 11, P / S — 0,5.
Alaska Air Group is the only air carrier on the list. IN 2021 year, the company's shares rose by 38%, and growth potential, according to analysts, is 21%. Goldman Sachs talks about the company's strong balance sheet at the beginning of the pandemic and counts, that Alaska Air Group may start paying its debts in the second half 2021 of the year.
Companies with high profitability in inflationary periods
| Ticker | Nov 2003 - sep 2006 | Oct. 2010 - Jan 2012 | Growth potential | Recommend to buy | |
|---|---|---|---|---|---|
| Valero Energy | FLEA | 74,2% | 27,4% | 10,7% | 84,2% |
| Had | AVNT | 12,6% | 10,1% | 15,2% | 81,8% |
| Danaher | DHR | 19,5% | 16,6% | 20,5% | 81,8% |
| Cigna | CI | 31,7% | 21,4% | 14,6% | 80,8% |
| Alaska Air Group | ALK | 10,4% | 33,8% | 20,8% | 80,0% |
| ConocoPhillips | COP | 32,2% | 15,1% | 18,7% | 80,0% |
| Decker Outdoor | DECK | 44,1% | 30,1% | 23,5% | 78,6% |
| Exelixis | EXEL | 9,7% | 14,9% | 35,7% | 78,6% |
| Synaptics | SON | 22,6% | 32,3% | 30,2% | 78,6% |
| EQT | EQT | 23,1% | 29,1% | 14,9% | 77,3% |
| Timken | TKR | 23,8% | 15,8% | 14,4% | 75,0% |
| McKesson | MCK | 23,7% | 19,7% | 17,7% | 73,7% |
| Darling Ingredients | DAR | 15,6% | 40,0% | 23,6% | 72,7% |
| Pioneer Natural Resources | PXD | 12,7% | 32,5% | 24,3% | 72,2% |
| Papa John’s | PZZA | 42,6% | 38% | 23,2% | 72,2% |
| PTC | PTC | 29,0% | 13,5% | 19,6% | 70,6% |

