Description of the rsi indicator
This indicator displays "momentum" - speed and amplitude, with which the price movement changes; how much the price changes in the direction of its movement. In other words, RSI indicator shows the strength of the trend and the likelihood of its change.
Everything, enough history. Let's get to the point ?
RSI indicator ( Relative Strength Index , relative strength index) - one of the most important and most famous indicators, which is used by traders all over the world. By its nature, the RSI indicator is an oscillator, i.e. fluctuates in a certain zone, limited to maximum(100) and the minimum value(0).
I will not paint the formula here, based on which the indicator is built, but, Tell, that she's pretty simple. The indicator is based on the analysis of prices for CLOSING candles for a certain period of time and their relative difference(candle shadows are not taken into account when plotting the indicator - only close values are taken). Roughly speaking, indicator shows, how strong the movement is over a period of time, based on the "strength of the candles" for this very period. Unclear? ? Understand, it can be difficult at first. For ease of perception, I will depict the described principle on the graph.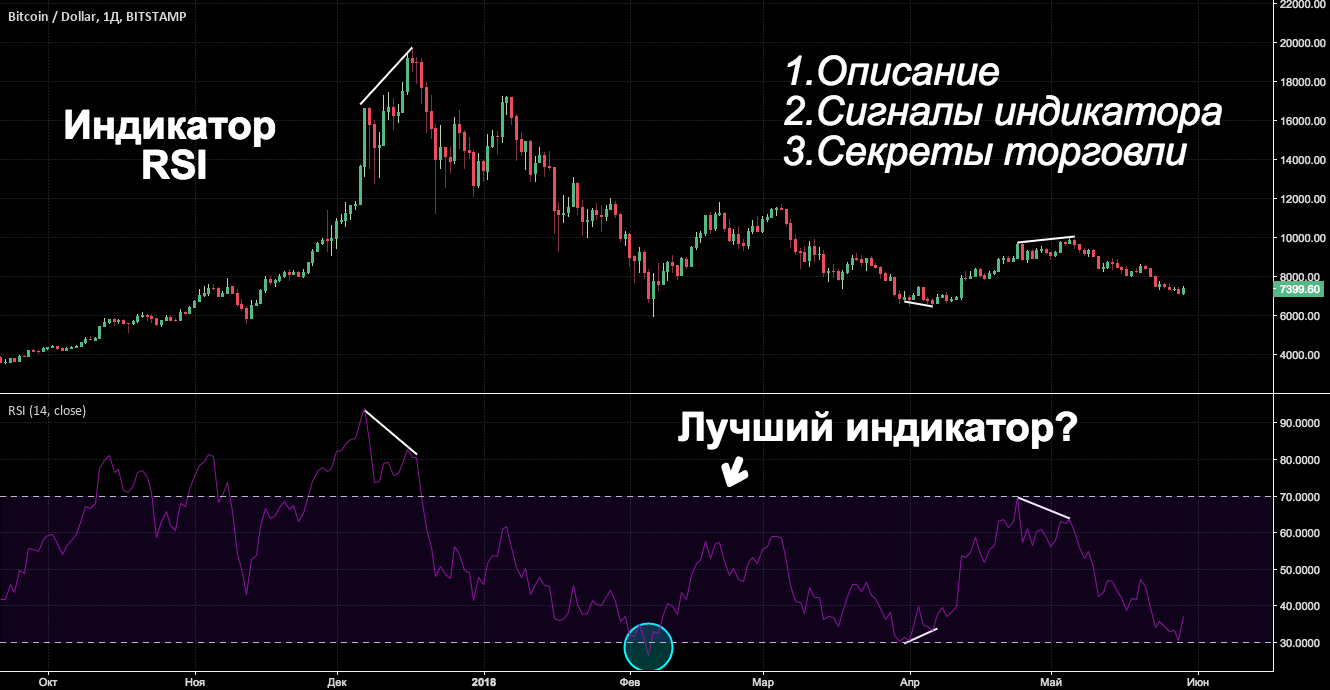
For buy trades, reverse conditions.
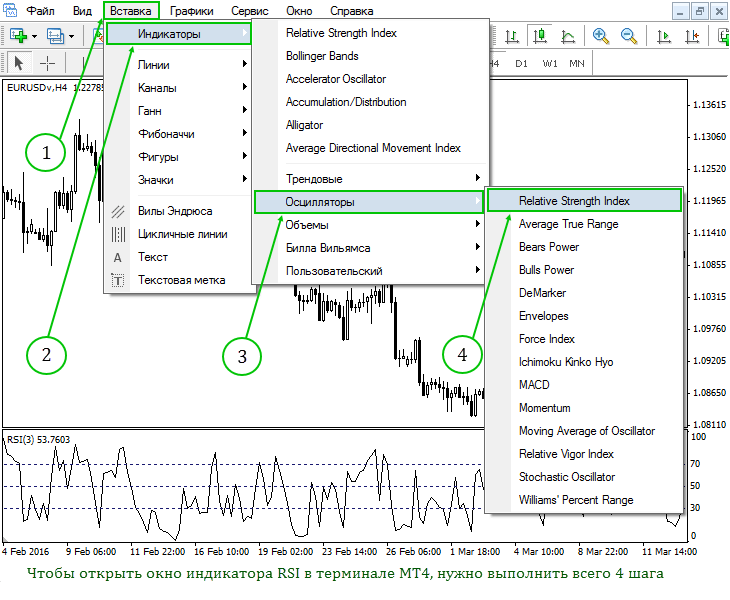
The Relative Strength Index is included in the standard equipment of the MT4 and MT5 trading platforms.. To add it to schedule of the trading instrument open the menu "Insert / Indicators / Oscillators / Relative Strength Index"
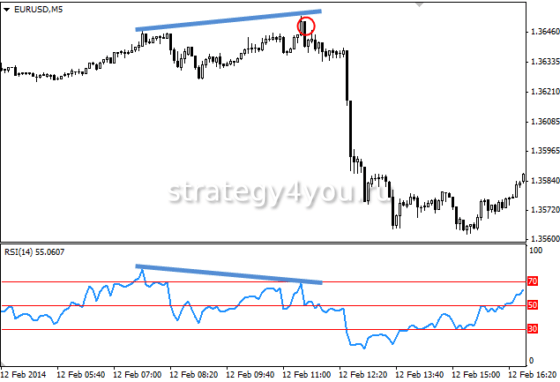
One of the most commonly used indicator analysis methods is based on finding discrepancies. (divergences), at which the value of a trading instrument forms a new maximum, and the RSI fails to surpass its previous high. The discrepancy between such a plan suggests that, that there is a high probability of a price reversal. If the RSI subsequently falls below the last trough, then, so-called, The "failed swing" ends and is considered evidence of an imminent price reversal.
A simple trading system based on the RSI Relative Strength Index indicator
Observe Money Management. Never risk more than 2 percent of your capital in one trade. This approach will protect you from ruin and will allow you to consistently earn on Forex using the RSI indicator .
By the way, the name "Index of Relative Strength" was not chosen very well at the time. The RSI indicator demonstrates the non-relative strength of the compared trading instruments, and the internal force of a single instrument, therefore, it would be more logical to call it the "Index of Inner Strength". However, what is what is, the name given to the indicator stuck.
Relative Strength Index (Relative Strength Index, RSI)
Opening deals for sale:
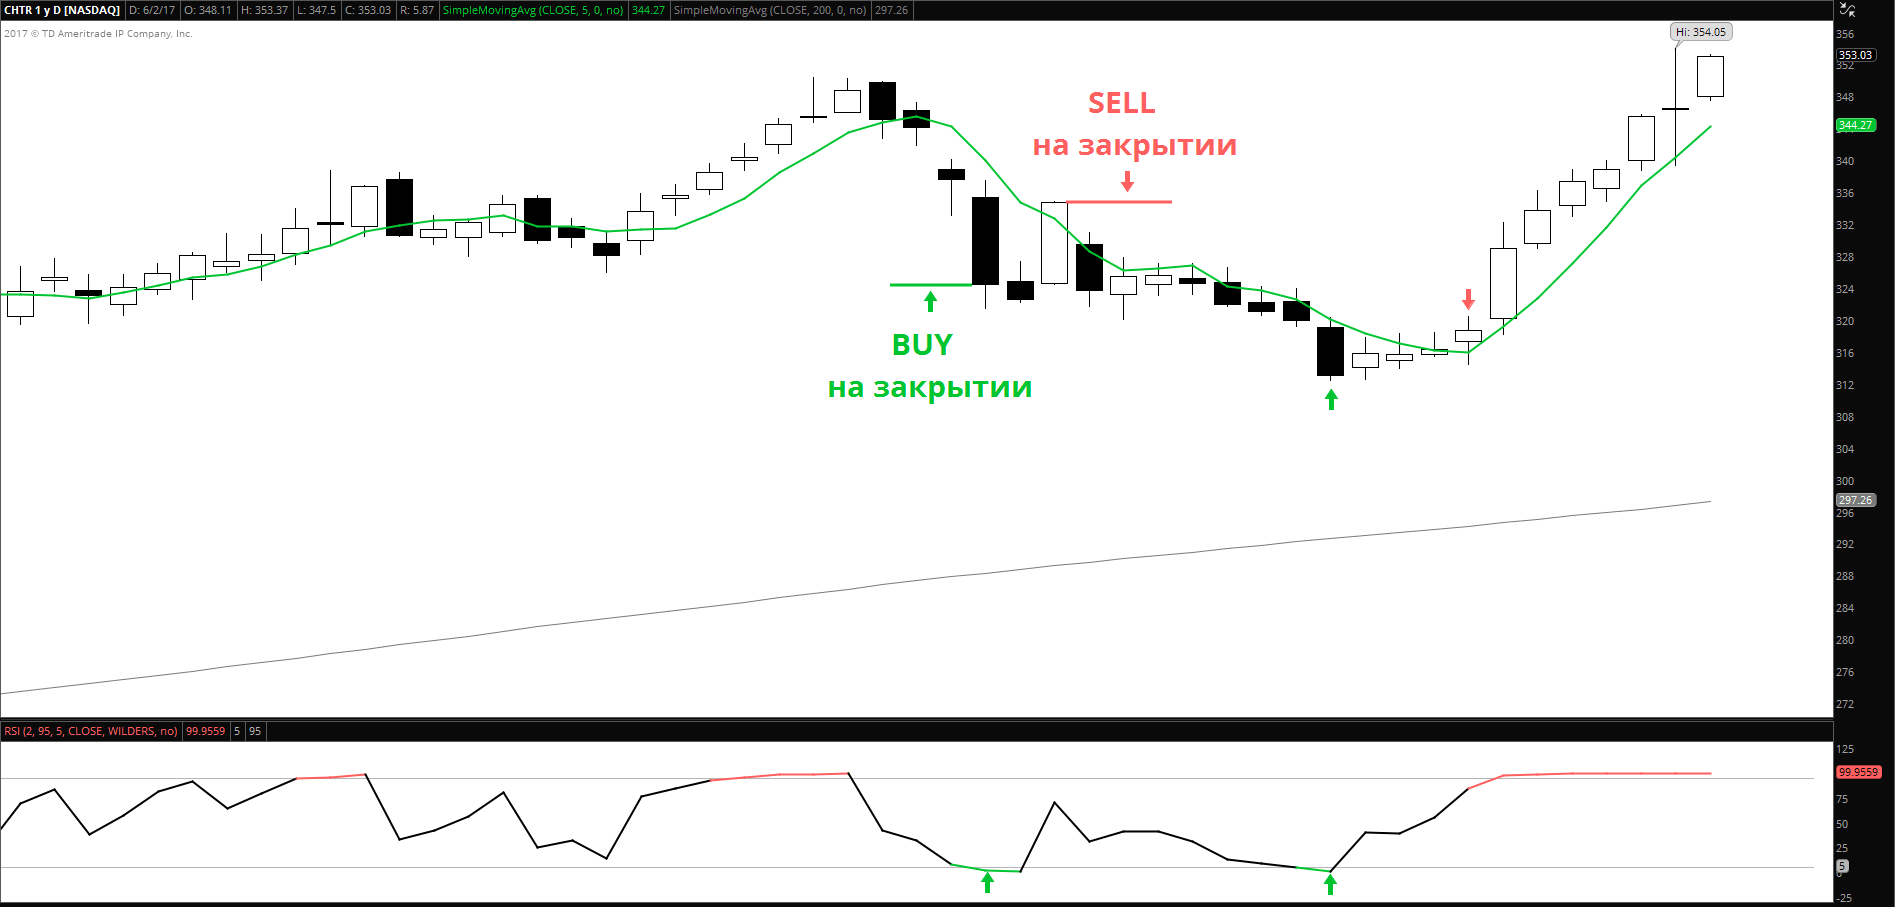
After reading Larry Connors' Short Term Trading Strategies, that work ”I was very interested in the use of RSI with a period 2 or 3 to find pullbacks and trading opportunities. I began to give even more confidence to this indicator., when acquired some Connors RSI research on historical data.
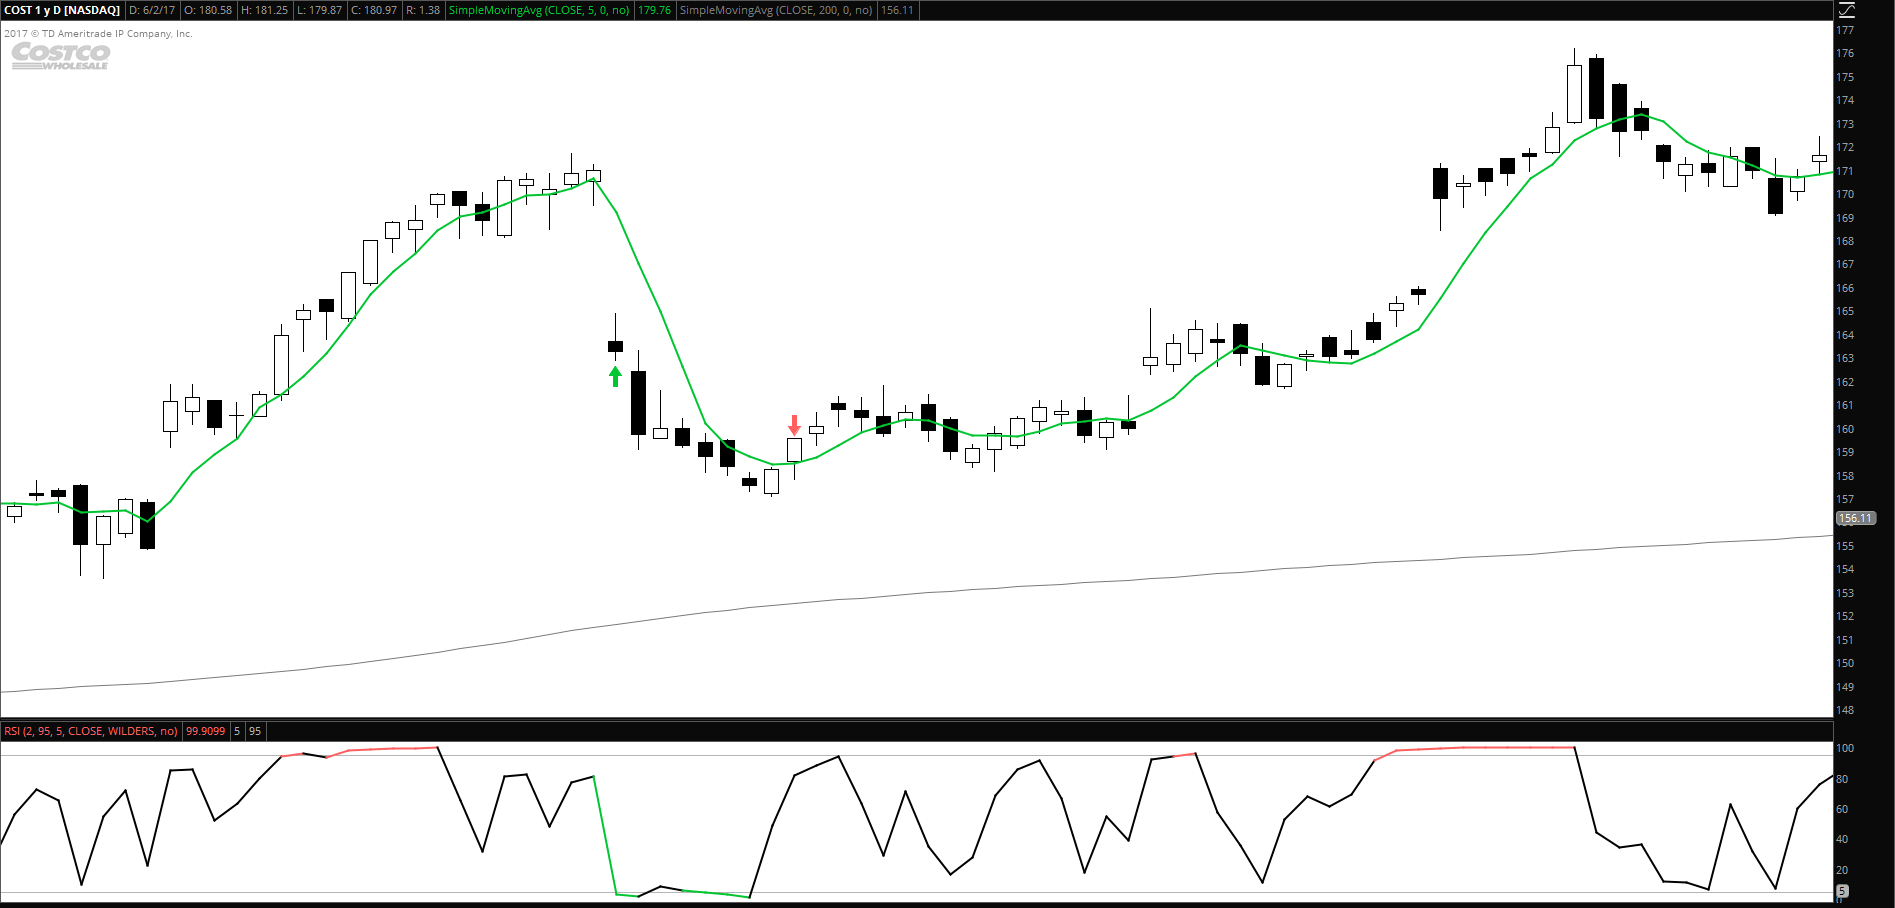
The image below shows the daily CHTR chart with a green line, responsible 5 MA, gray line - 200 MA and RSI 2-period below. 2 trading signals were marked with arrows, both with a positive result.
Parameters and rules
Position closing criteria:
At the heart of the BB indicator (Bollinger Bands) the same moving average lies, but supplemented by two lines above and below, which are the standard deviation of the price. Using Bollinger Bands as a Tool for Closing Positions, we lengthen our time in the deal, and also increase the possible profit.
p, blockquote 5,0,0,0,0 —>
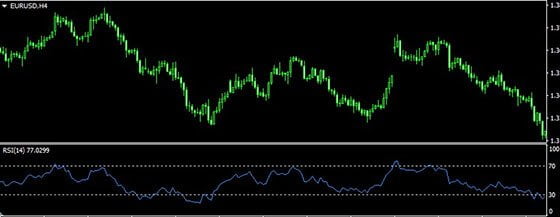
Signal spectrum, which this tool gives to the trader, quite wide, but all of its signals can be classified into three categories.
Everyone trader selects indicators for himself, based on the characteristics of the trading strategy used by him. Choose and set such parameters of the RSI indicator, who would not conflict with her. If you know, how exactly will you trade, then it is better to use those trading instruments, which will help you realize your plans. Remember, strategy is primary, and the choice of an auxiliary indicator is secondary.
Analyzing the RSI indicator, it can be concluded, what his signals are important, when its curve is outside the oversold / overbought zones. The fact, that the price can rise or fall, while the indicator curve is still trampled in these zones.
Analysis of graphic models
The result of this comparison is the curve, lying within the range of values from 0 to 100%.
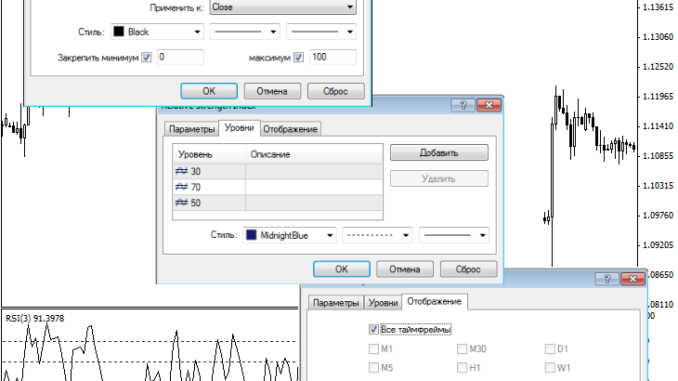
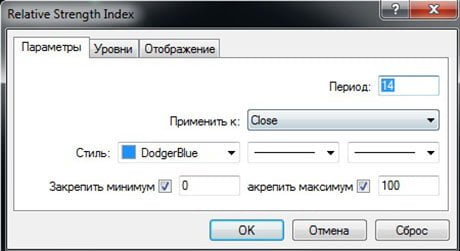
As you can see from the picture above, there are three tabs in the RSI indicator properties window: "Parameters", "Levels", "Display".
What period is optimal for trading? Difficult to answer unequivocally, as it depends on many factors:
Let's see, how the rsi indicator will change on the chart with different values of the periods - "5", «14», «30».
When determining the state of a currency pair in the market, one should not forget about the line 50 . She is considered neutral, ie. punching it in different directions may indicate a change in the existing trend. Examining the graphs makes it possible to see, that the middle axis in a strong trend often becomes a resistance line. With an upward trend, the falling price should bounce off 50 lines and aim up again. For example, a trader has found a supposedly growing trend, to make sure of this, you need to wait for the breakdown of any line above the mark 50.
To activate it on the current chart, you need to click on the "Insert" section, then go to "Indicators", select "Oscillators" and Relative Strength Index in the drop-down list. After that, a window with RSI settings will appear. Optimal values are set in the program, which are not recommended to be changed by novice exchange players. More experienced traders adjust the values according to their own needs, but only after a complete study of the instrument.
Now you need to figure it out, how to use the RSI indicator to identify overbought and oversold levels . The rapid rise of the indicator with rapid price movement informs the user that, that the currency pair is in the overbought zone and soon this trend will be exhausted, the cost will start to fall. Therefore, the trader needs to take appropriate measures. More often than not, the moment comes then, when the RSI rises above the mark 70.
Failed swing
Adding a moving average line oscillator to the chart will help smooth out jumps in the RSI curve and determine the direction of the trend.. The moving averages are displayed on the chart in red, and the position of the index band relative to them will indicate the movement of the formed trend.
Welles Wilder describes the situation in his scholarly work, which can manifest, when the instrument is in overbought or oversold zones. It's called "failed swing", at the position of the top is characterized by the formation candles with a peak below, than last time. And the fall comes even lower, than last time. In the base position, the situation is somewhat different.. Falling indicator, outside the mark in 30, will not fall below, than you fell the last time, and during the increase it will rise above the tip of the previous candle.
By default, the instrument settings have a period of 14 days . But sometimes you need to discard false signals and look at other time periods.. For example, with M1 timeframe, the currency pair will be in the oversold zone, and a change in the period on H4 will signal overbought.
A similar situation occurs with a downtrend.. Experts recommend not to make hasty decisions and use the line 50 RSI indicator to confirm the assumptions about the trend movement.
(Views 3, 1 views today)Previous
