Center line crossing occurs, when the MACD line moves into positive or negative area. When it crosses above the center line, a positive MACD value indicates, what's the 12-day EMA more, than 26 days. Against, negative MACD is shown, when the MACD line is below the center line, meaning that the average value for 26 days above, than for 12 days. In other words, a positive MACD line indicates a stronger upward momentum, and negative may indicate a stronger downward bias.
How the MACD Indicator Works
Designed by Gerald Appel in the late 1970s, Moving Average Convergence Divergence indicator tracks pricing events, which have already happened, and thus, falls into the category of lagging indicators (that provide signals based on past or current price fluctuations). MACD can be useful for measuring market momentum and possible price trends and is used by many traders to identify potential entry and exit points..
How MACD works
The MACD indicator is generated by subtracting two exponential moving averages (EMA) to create the main line (MACD lines), which is then used to calculate another EMA, representing the signal line.
Besides, there is a MACD histogram, which is calculated based on the differences between the two lines. The histogram, along with two other lines, fluctuates above and below the center line, which is also called the zero line.
Therefore, the MACD indicator consists of three elements, moving around the zero line:
MACD line (1): helps to identify upward or downward momentum (market trend). It is calculated by subtracting two exponential moving averages.
Signal line (2): EMA lines MACD (usually EMA with 9 periods). Combined analysis of the signal line with the MACD line can be useful for identifying potential reversals or entry and exit points.
Histogram (3): graphical representation of the divergence and convergence of the MACD line and the signal line. In other words, the histogram is calculated based on the differences between the two lines.
MACD line
Generally, exponential moving averages are measured according to the closing prices of the asset, and periods, used to calculate two EMAs, usually installed as in 12 periods (Faster) so in 26 periods (slower). The period can be configured in different ways (minutes, clock, days, weeks, months), but this article will focus on daily settings. Nevertheless, MACD indicator can be customized to suit different trading strategies.
Taking standard time ranges, the MACD line itself is calculated by subtracting the 26-day EMA from the 12-day EMA.
As mentioned, MACD line fluctuates above and below the zero line, and that's that, what signals the crossing of the center line, informing traders, when the 12-day and 26-day EMA change their relative positions.
Signal line
By default, the signal line is calculated based on the 9-day EMA of the main line and as such, provides additional information about his previous movements.
And although they are not always accurate, when the MACD line and the signal line cross, these events are usually seen as signals of a trend reversal, especially when they occur at the ends of the MACD chart (much above or much below the zero line).
MACD histogram
Histogram — it is nothing more than a visual record of the relative movements of the MACD line and the signal line. It is simply calculated by subtracting one from the other.:
However, instead of adding a third moving line, a histogram consists of bars on a graph, making it visually easy to read and interpret. note, that the bars of the histogram have nothing to do with the trading volume of the asset.
MACD settings
As stated earlier, default settings for MACD are based on EMA with 12, 26 And 9 day periods, hence, MACD (12,26,9). Nevertheless, some technical analysts change periods, to create a more sensitive indicator. For example, MACD (5,35,5) — this is the one, which is often used in traditional financial markets along with longer timeframes, such as weekly or monthly charts.
It is worth noting, that due to the high volatility of cryptocurrency markets, increasing the sensitivity of the MACD indicator can be risky, because it can lead to more false signals and misleading information.
How to read MACD
As the name suggests, moving average divergence and convergence indicator tracks the relationship between moving averages, And correlation between two lines, can be described as converging and diverging.
Nevertheless, the corresponding signals of the MACD indicator are associated with the so-called crossovers, which happen, when the MACD line crosses above or below the center line (center line crossing) or above or below the signal line (crossing the signal line).
Remember, what is the intersection of both the center line, so the signal line can happen many times, creating many false and cunning signals, especially with regard to volatile assets, such as cryptocurrencies. Therefore, do not rely only on the MACD indicator..
Center line crossing
Center line crossing occurs, when the MACD line moves into positive or negative area. When it crosses above the center line, a positive MACD value indicates, that the 12-day EMA is greater, than 26 days. Against, negative MACD is shown, when the MACD line is below the center line, meaning that the average value for 26 days above, than for 12 days. In other words, a positive MACD line indicates a stronger upward momentum, and negative may indicate a stronger downward bias.
Crossing the signal line
When the MACD line crosses the signal line, traders often interpret it as a potential buying opportunity (entry point). On the other hand, when the MACD line is below the signal line, traders tend to view this as a selling opportunity (exit point).
While signaling intersections can be helpful, they are not always reliable. Also worth considering, where are they located on the graph, to minimize risks. For example, if the intersection requires a purchase, but the MACD line indicator is below the center line (negatively), market conditions can still be considered bearish. And vice versa, if the crossing of the signal line indicates a potential sell point, but the MACD line indicator is positive (above the zero line), market sentiment may still be bullish. In this scenario, following the sell signal may carry more risk. (considering trends).
MACD and price divergence
Along with the intersection of the center line and the signal line, the MACD can also provide insight into the differences between the MACD chart and the price action of an asset..
For example, if the price activity of the cryptocurrency shows a higher high, while MACD creates a lower, most likely there will be a bearish divergence, indicating that, that despite the price increase, growth momentum (buying pressure) not so strong, how was, bearish divergences are commonly interpreted as selling opportunities, because they, usually, precede price reversals.
Against, if the MACD line forms two upward lows, which coincide with two falling lows of the asset price, then this is considered a bullish divergence, assuming, that despite the price decrease, buyer's pressure is stronger. Bull divergences, usually, precede price reversals, what could indicate a short-term bottom (from downtrend to uptrend).
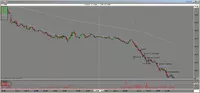
Let's give an example on the daily EUR 6E futures chart. Our MACD indicator looks like a histogram. We have added two simple moving averages to the price chart - red with a period 12, blue with period 26. Indicator signals appear faster, than average crossings on the chart, even if we reduce the period of simple moving averages.
About the creator of the MACD indicator
Gerald Appel was born into a poor family. His father was a taxi driver, and spent all the money at the races. Gerald was the eldest boy from 4 children in the family. He became interested in markets in the mid-1960s.. At the same time, Gerald began trading and writing articles on stock topics..
IN 1973 year he created an analytical newsletter , now it is maintained by his son. At the same time, Gerald created the investment fund Signalert Corporation and managed it until his retirement in 2012 year. The foundation is now also managed by his son.
Appel wrote 17 books, 2 of which were named “Investment Books of the Year”. But most of all he is known as the author of the MACD indicator, which is currently included in almost all trading platforms.
The indicator name stands for Moving Averages Convergence / Divergence.
An important rule is that divergences should be looked for near the end of the trend.. The signal is ineffective on pullbacks or lateral.
(Views 4, 1 views today)