Anatomy of Japanese candles
As known, schedule Japanese candlesticks are very popular among traders in all markets. Let us recall again, what are Japanese candlesticks.
Each candlestick on the chart reflects price movement during a specific timeframe. The body of the candlestick is formed by the opening and closing prices, and shadows are highs and lows.
The upper shadow of the candlestick is a vertical line, showing the difference between the high and the close for a bullish candle and the difference between the high and the open for a bearish.
If the closing price is higher than the opening price, the candle is bullish, and vice versa. A separate case is the so-called doji candle, where the opening price is equal to or approximately the same as the closing price.
The body of the candlestick represents the difference between the opening and closing prices. A bullish candlestick with a relatively large body indicates pressure on the market from buyers, large bearish - about the dominance of sellers.
Every single candle, as well as their various combinations carry a lot of valuable information about the state of affairs in the market. Furthermore, many are convinced, that Japanese candlesticks themselves are a fairly reliable technical indicator, and not just a variant of displaying prices on a chart. Among other things, Japanese candlesticks can be effectively analyzed on almost any timeframe - be it daily or half-hour chart.
Note, but, that a single candlestick does not contain direct information about price movements within a particular time interval. There is no indication that, the maximum or minimum was reached first, how many times have prices decreased or increased. For instance, if the price contains upper and lower shadows, it is impossible to say unequivocally, first the price went down or up. To find out, it is necessary to study charts of a smaller timeframe.
Years of observation of candlestick charts have allowed traders to identify various signals, consisting of one, two, three or more candles. Let's consider in more detail the "anatomy" of Japanese candles, as well as elementary patterns based on them.
Candle body
A long candlestick body usually signals strong bull or bear pressure on the market.. Short candlestick bodies usually indicate low trading activity., and / or the relative equality of power between buyers and sellers during periods of market consolidation.
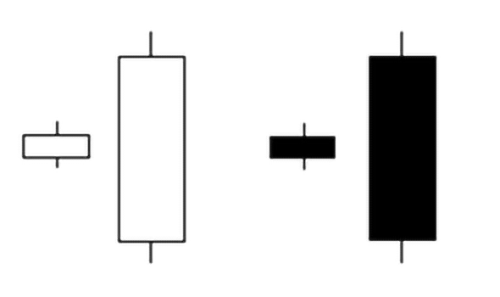
Bullish candles with a large body indicate significant buying pressure on the market. The longer the body of such a candle, the greater the difference between the closing and opening prices.
On the other hand, such candles should be considered each time in the context of a particular market situation. For example, if a large bullish candle appears suddenly after an extended downtrend, then this may indicate a high probability of a reversal, a strong support level and / or exit from the deeply oversold zone.
Similarly, if after a long "tuzemun" a large red candle appears - this may indicate an important resistance level has been reached and / or an exit from a strong overbought level.
Candle shadows
The upper and lower shadows of candles also carry valuable information.. So, if a bullish or bearish candlestick has both short shadows, this indicates, that most trades are executed in the range between the opening and closing prices. If the shadows of the candles are long, this means, what, vice versa, most trades were carried out outside this range.
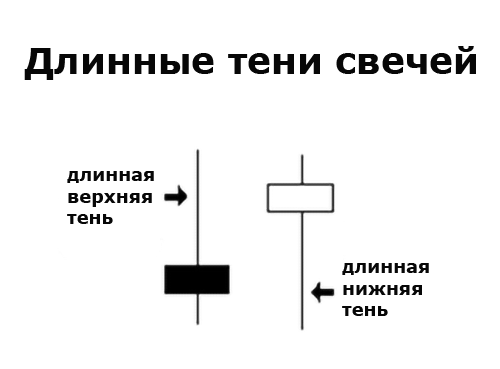
A candlestick with long upper and short lower shadows indicates the continued dominance of bulls within a given interval, to the end of which, but, increased activity of bears. And vice versa, a candlestick with long lower and short upper shadows indicates, that sellers dominated for a while, who then lost ground somewhat under the onslaught of buyers.
Spinning top (Spinning Top)
Japanese candlesticks with long upper and lower shadows, which, wherein, short body, Called spinning tops. The appearance of such candles on the chart indicates a high degree of uncertainty in the market.. In this case, the color of the top does not play a special role..
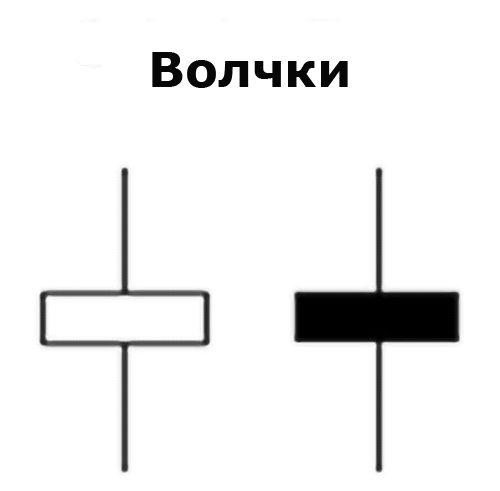
The short body and long shadows of the spinning top indicate significant bull-like activity., and bears, and also about the approximate equality of their forces.
If a spinning top appears after a big bullish candle, this indicates a decrease in pressure from buyers. AND, vice versa, if a spinning top appears after a bearish candle with a long body, this will indicate a weakening of pressure from sellers. Both situations signal a high probability of a trend reversal..
Marubozu
Candles with a mysterious name should be included in a separate category «Marubozu». They are distinguished by the complete absence of shadows.. This, in its turn, means, that the opening and closing prices coincide with the highs or lows (depending on, bullish or bearish candle).
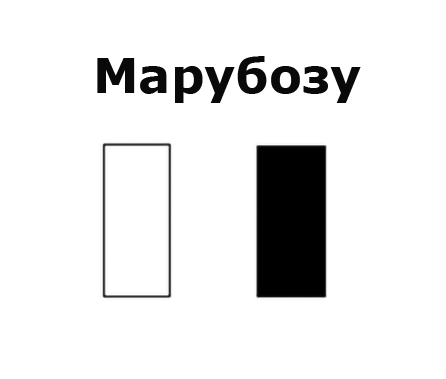
The appearance of such candles indicates the undivided domination of buyers or sellers. (depending on the color of the marubozu) within a particular timeframe.
Such candles can signal an obvious continuation of the trend., or a bullish / bearish reversal (if a, respectively, the Marubozu candlestick was preceded by a steady downtrend / uptrend).
Doji
A characteristic feature of this type of candlestick is full or (almost complete) no body. It means, that the opening and closing prices of the doji are the same or very close to each other.
On the chart, the body of such a candlestick often looks like a thin line. The doji itself may look like a "+", letter "T" (including inverted) or as a small horizontal line.

Doji can signal uncertainty in the market and / or a confrontation on an equal footing between bears and bulls. The very small body of the candle and large shadows indicate that, that the price moved significantly above and below the opening price, and eventually closed very close to the original level. In this way, neither to buyers, neither sellers managed to gain the upper hand in the confrontation - there was a kind of "draw" in the market.
If a doji appears on the chart, you should pay close attention to the nature of the previous candles. So, if the doji formed after a series of large bullish candlesticks, it will talk about, that the buyers are already a little "exhausted" and, quite possible, sellers are preparing for a powerful counterattack.
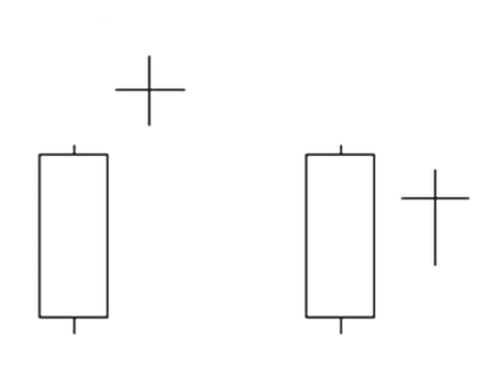
If the doji occurs after a series of large bearish candles, then this will signal a weakening of pressure on the market from sellers and a possible reversal of the movement.
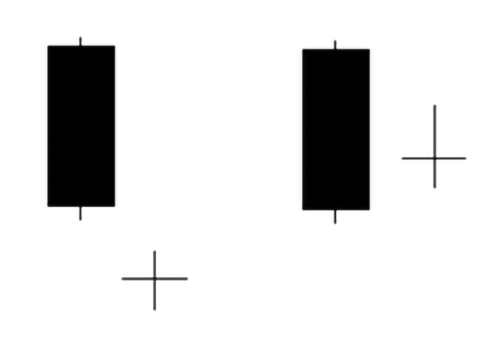
In this way, the Doji candle itself is a neutral pattern. This means, that the bullish or bearish nature of such a pattern is determined by further confirmation. On the other hand, if the doji appears among other candles with a small body, the significance of such a pattern is significantly reduced.
A candle with a funny name "Long-legged doji" (rice. 6) traders sometimes refer to it as "rickshaw". Such a candle is distinguished by the presence of approximately equal upper and lower shadows., as well as a tiny body. The appearance of a "rickshaw" indicates significant uncertainty in the market and a fairly high probability of a trend reversal.
Candle Dodge dragonfly (rice. 6) formed in a situation, when the opening prices, the close and the maximum are the same, and the minimum forms a long lower shadow. The result is a candle, similar to the letter "T".
Such a candle suggests, that sellers dominated the market for some time, however, by the close of the trading session, the advantage passed to the bulls. This brought the closing price to the opening level, which is at the same time the session maximum.
Dragonfly signals a possible trend reversal. However, much depends not only on the nature of the previous candles., but also from further confirmation. See also, that the long lower shadow speaks not only of the significant activity of the bulls, but also about the significant pressure of bears on the market. Confirmation for a reversal after an uptrend is the replacement of the "dragonfly" with a long bearish candle. And vice versa, if a doji dragonfly appears after a downtrend, and behind it is a big bullish candle, then this will indicate a radical change in the trend.
Tombstone doji (rice. 6) looks like an inverted "T". For such a candle to appear, it is necessary, so that the minimum price, opening and closing were equal, and the maximum formed a long upper shadow.
"Headstone" bears witness to the initial dominance of the bulls, which then gave way to the dominance of bears. By the end of the trading session, the latter pushed the price to the opening level, which is at the same time the minimum.
The appearance of a "gravestone" after an uptrend may indicate a failed attempt by the bulls to consolidate their dominant position in the market.. The reversal can be confirmed by the appearance of a large bearish candle.
If the "gravestone" appears against the background of a stable downtrend or near a solid support level, then it signals the weakening of bears and the strengthening of the strength of the bulls. However, a large bullish candle is needed to confirm the trend reversal after the Doji..
The Hammer and the Hanged Man
Some of the simplest single-candlestick patterns are the Hammer and the Hanged Man.. Separately, such candles are absolutely identical., however, it all depends on the trends that precede them.
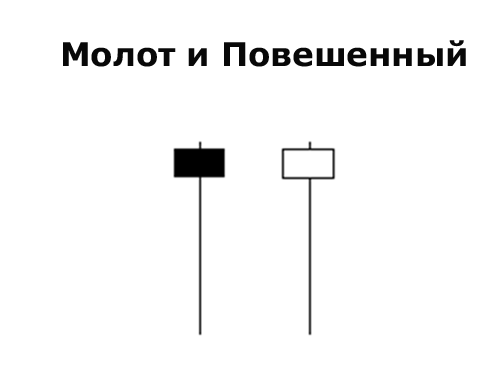
Both candles are characterized by small bodies., long bottom shadows, and also the absence of upper shadows. However, on practice, the presence of the latter is allowed, but very short.
Hammer is a bullish reversal pattern, which forms in the context of a downtrend. Traders often perceive the Hammer as a signal that, that the “bottom” is already very close and an upward movement is about to begin.
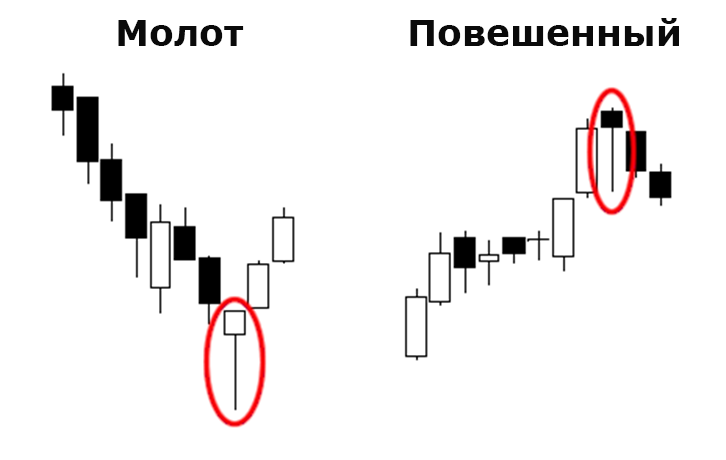
The long lower shadow of the Hammer suggests, that the sellers put in a lot of effort, to push the price down, however, they were not enough for more - the bulls prevailed in the confrontation, as a result, closing the candle near the opening price.
However, in order to enter a trade safely, it is advisable to wait for additional confirmation.. It can become, for example, subsequent big bullish candle, which closed above the opening price of the Hammer.
Important characteristics of the Hammer:
- long bottom shadow, two to three times the size of the candlestick body;
- small upper shadow, or better, her absence;
- the color of the candle does not play a special role, although some experts believe, that in the short term, the green Hammer is more reliable than the red;
- the appearance of the Hammer must be preceded by a steady downtrend.
Hanged is a popular single-candle model, signaling a bearish reversal. The appearance of such a candle (rice. 10) against the background of an uptrend, it may indicate a collision with a serious resistance level, and that, that sellers are gradually gaining the upper hand over buyers.
So, a long lower shadow indicates, that the bears seriously tried to push the price below. Buyers intervened, however all, what they managed to achieve was only to close the price near the opening level, no more.
Criteria for the identification of the Hanged Man:
- the appearance of this candle should be preceded by a steady uptrend;
- the length of the Hanged Man's body should be small in comparison with previous candles;
- the color of the Hanged Man does not play a special role (however, in the short term, a bearish candle is considered more reliable than a bullish one);
- the length of the Hanged Man's lower shadow should be two to three times the size of the candle's body.
Besides, the signal requires mandatory confirmation in the form of a subsequent large bearish candle. It is also desirable to have a price gap between the Hanged Man and the previous candle.
Inverted Hammer and Shooting Star
These patterns taken separately from one candlestick look absolutely identical.. As with the Hammer and the Hanged Man, it all depends on the direction of the previous trend.
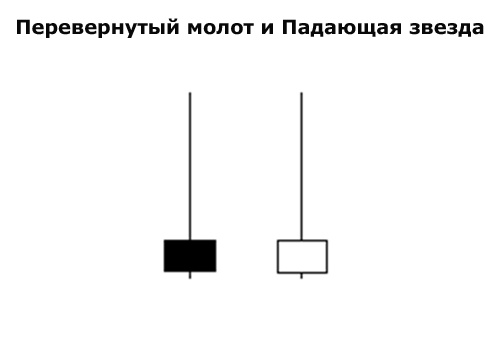
So, Inverted hammer completes the downtrend and marks the upcoming bullish reversal. Shooting star, against, forms at the top of an uptrend, anticipating a significant price reduction.
These candles are characterized by a tiny body and a long upper shadow., or the absence of the latter.
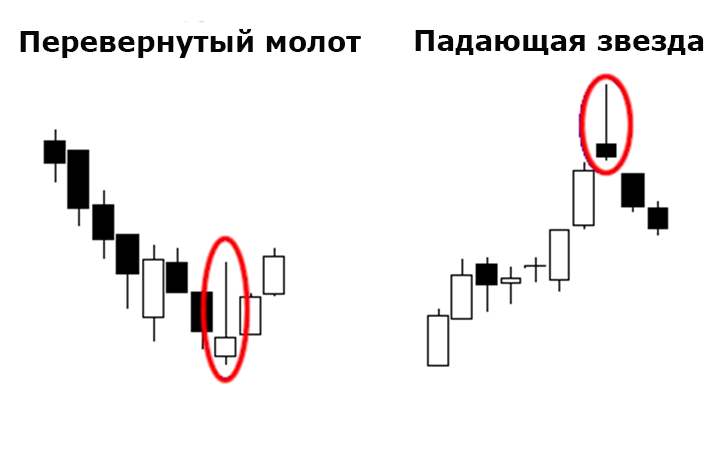
As you can see in the figure above, An inverted hammer may appear amid a downtrend. Such a candlestick indicates a high probability of a reversal.. In particular, the long upper shadow speaks of the determination of the bulls, despite, that they managed to close the price only near the opening level. At the same time, the bears are already running out of strength., to keep the price down. In other words, most of those, who was going to sell the asset, already done it.
Candlestick Patterns Shooting star represent bearish reversal patterns. The shape of such a candle suggests, that the candlestick opened near the low of the trading session, jumped up, however, soon, under the onslaught of bears, the price slid down.
In other words, bulls tried to continue pushing the price up, however, they were effectively prevented by determined bears. Shooting star - bearish signal, who says, about that, that there are much fewer buyers, than sellers.
Absorption
Popular U-turn pattern A bullish engulfing consists of two candlesticks – a bearish and a larger bullish one. This pattern forms at the end of a downtrend (less often - after a period of consolidation), signaling a likely reversal and subsequent vigorous upward movement.
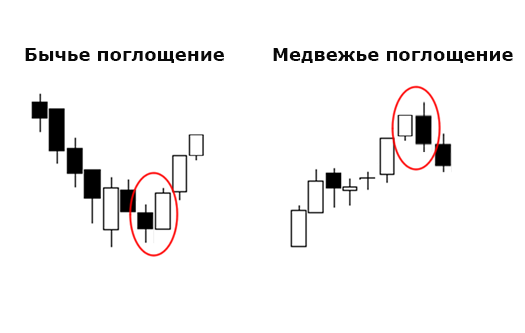
Bullish engulfing. Such a pattern is formed, when a large bullish candle appears after a small bearish candle. The latter should cover the body of the bearish candle. Also desirable, so that the opening price of a bullish candlestick is significantly lower than the closing price of a bearish candle (such a price gap significantly strengthens the model). At the same time, the size of the bearish candlestick body does not play a special role - the main thing is, so that it is not doji, which is too easy to absorb.
A source: https://forklog.com/v-kopilku-kriptotrejderu-yaponskie-svechi-i-modeli-na-ih-osnove/
