Chinese holding Alibaba Group (NYSE: BABA) 13 May reported for the fourth quarter and fiscal year 2021. The company's annual revenue increased by 41% — up to 717.3 billion yuan. Excluding Consolidation Sun Art, Chinese hypermarket chain, sales have increased 32%.
Alibaba's net income hit by 18.2 billion yuan antitrust fine (2,8 billion dollars), imposed by the Chinese authorities. The company posted a loss of 5.5 billion yuan in the fourth quarter. (836 million dollars). Annual net profit increased by 1% - up to 150.3 billion yuan, and adjusted earnings increased by 30% — up to 172 billion.
Annual revenue in Core commerce, a key operating segment, grew by 42%. Core commerce are Taobao retail platforms, Tmall и Aliexpress, wholesale 1688 and Alibaba, as well as various logistics and consumer services. Segment share — 87% of total revenue.
The Cloud Computing segment in 2021 financial year added 50%, and in the fourth quarter 37%. The segment began to grow more slowly, as the leading foreign customer refused the company's cloud services. Cloud computing is still unprofitable and does not make a profit.
In the next financial year, the company's management plans to increase revenue by 30% - up to 930 billion yuan.
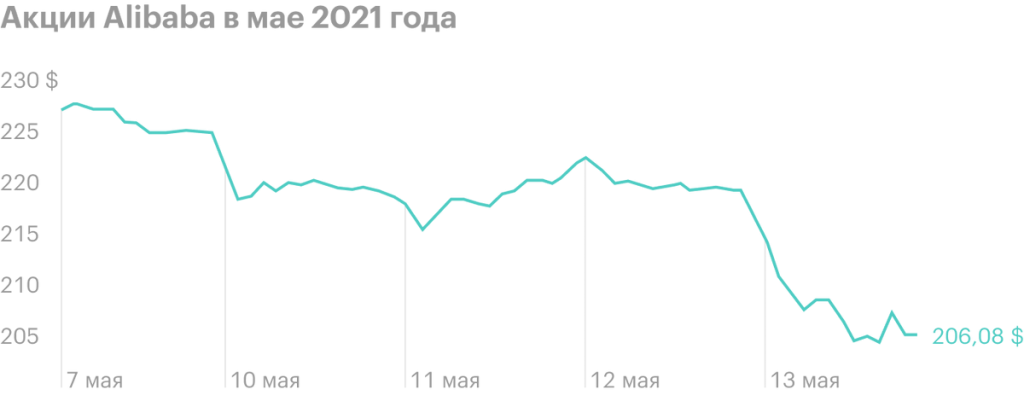
Despite rising sales across the board and a positive outlook, 13 May, Alibaba shares fell by 6,3%. For the last 12 months, the company's shares rose by 2,4%.

Alibaba Revenue by Segment for the Fourth Quarter, billion yuan
| 2020 | 2021 | The change | |
|---|---|---|---|
| Core commerce | 93 865 | 161 365 | 72% |
| Cloud computing | 12 217 | 16 761 | 37% |
| Digital media and entertainment | 7198 | 8047 | 12% |
| Innovation initiatives and others | 1034 | 1222 | 18% |
| Total | 114 314 | 187 395 | 64% |
Core commerce
2020
93 865
2021
161 365
The change
72%
Cloud computing
2020
12 217
2021
16 761
The change
37%
Digital media and entertainment
2020
7198
2021
8047
The change
12%
Innovation initiatives and others
2020
1034
2021
1222
The change
18%
Alibaba's Fourth Quarter Highlights, billion yuan
| 2020 | 2021 | The change | |
|---|---|---|---|
| Revenue | 114 314 | 187 395 | 64% |
| Profit | 3162 | −5479 | — |
| Adjusted profit | 22 287 | 26 216 | 18% |
Revenue
2020
114 314
2021
187 395
The change
64%
Profit
2020
3162
2021
−5479
The change
—
Adjusted profit
2020
22 287
2021
26 216
The change
18%
Alibaba Revenue by Segment for Fiscal Year 2021, billion yuan
| 2020 | 2021 | The change | |
|---|---|---|---|
| Core commerce | 436 104 | 621 146 | 42% |
| Cloud computing | 40 016 | 60 120 | 50% |
| Digital media and entertainment | 29 094 | 31 186 | 7% |
| Innovation initiatives and others | 4497 | 4837 | 8% |
| Total | 509 711 | 717 289 | 41% |
Core commerce
2020
436 104
2021
621 146
The change
42%
Cloud computing
2020
40 016
2021
60 120
The change
50%
Digital media and entertainment
2020
29 094
2021
31 186
The change
7%
Innovation initiatives and others
2020
4497
2021
4837
The change
8%
Alibaba Key Metrics for Fiscal Year 2021, billion yuan
| 2020 | 2021 | The change | |
|---|---|---|---|
| Revenue | 509 711 | 717 289 | 41% |
| Profit | 149 263 | 150 308 | 1% |
| Adjusted profit | 132 479 | 171 985 | 30% |
Revenue
2020
509 711
2021
717 289
The change
41%
Profit
2020
149 263
2021
150 308
The change
1%
Adjusted profit
2020
132 479
2021
171 985
The change
30%
