High Low (HOT@DE) one of the largest construction companies in the world, founded in 1874 in Frankfurt. The company has shares in Thiess, etching, Abertis, Turner, Sedgman, CPB. In Russia, the company is known for the reconstruction of the Sheremetyevo-1 and Sheremetyevo-2 air terminals. More than a half - 50,16% - Hochtief shares are held by the Spanish Actividades de Construccion y Servicios.
What's going on here
Readers have long asked us to start analyzing the reporting and the foundation of the business of foreign issuers.. Suggest in the company's comments, analysis of which you would like to read.
18 February Hochtief releases full year 2020 financials. Hochtief sales decreased by 11,2% compared to last year and amounted to 22.9 billion euros. The pandemic and related restrictions have led to a slowdown in sales and a delay in new orders. The company's result was also influenced by the sale of 50% of Thiess for 1.3 billion euros and the revaluation of the remaining 50%.
In 2020, the main regions for receiving revenue were America - 63% and Asia - 30%. Based on the indicators of the American unit, the main revenue segment is commercial construction, from the segment of general construction works - roads.
EBITDA decreased by 8,1% compared to last year - up to 1.7 billion euros, EBITDA margin was 7.4%. Hochtief earns € 477 million in operating income, decrease by 31,7%.
Mobility restrictions, imposed by governments, led to a decrease in profits of the operator of toll roads Abertis, which has 20% High Low. As a result, Hochtief's nominal net income was €427.2 million compared to a loss of €206.2 million in the same period last year.. Free cash flow decreased by 41,2% - up to 310 million euros - due to a decrease in operating cash flow and a share buyback program.
In fiscal year 2021, Hochtief expects to achieve a net operating income in the range of 410-460 million euros, growth will be 11-25%, adjusted for the disposal of a 50% stake in Thiess. The company will continue to bet on digital transformation and innovation through the creation of Nexplore, implementing AI, industry 5.0 trends and blockchain.
Financial indicators
Revenue fell by 11,21%. Top regions by revenue - Americas and Asia. The largest segment of the American division is commercial construction. EBITDA decreased by 8,17%. EBITDA margin increased by 0.1 percentage points. Operating profit fell by 31,75%. Net loss decreased three times and was replaced by net profit. Free cash flow fell by 41,2%.
Revenue by years, billion euros
| 2016 | 19,908 |
| 2017 | 22,630 |
| 2018 | 23,882 |
| 2019 | 25,851 |
| 2020 | 22,953 |
2016
19,908
2017
22,630
2018
23,882
2019
25,851
2020
22,953
Revenue by region, percentage of total
| America | 64% |
| Asia | 30% |
| Germany | 4% |
| Rest of Europe | 2% |
America
64%
Asia
30%
Germany
4%
Rest of Europe
2%
Segments of the American Construction Division
| Transport | 16% |
| Commercial building | 40% |
| Education | 11% |
| healthcare | 16% |
| Hotels | 3% |
| Industry | 2% |
| Public construction | 4% |
| Sport | 8% |
Transport
16%
Commercial building
40%
Education
11%
healthcare
16%
Hotels
3%
Industry
2%
Public construction
4%
Sport
8%
US General Construction Segments
| Roads | 44% |
| Bridges | 9% |
| Transit | 20% |
| Airports | 21% |
| Water | 6% |
Roads
44%
Bridges
9%
Transit
20%
Airports
21%
Water
6%
EBITDA of the company and its marginality, billion euros
| EBIDTA, billion euros | EBIDTA margin | |
|---|---|---|
| 2016 | 1,104 | 5,5% |
| 2017 | 1,320 | 5,8% |
| 2018 | 1,413 | 5,9% |
| 2019 | 1,892 | 7,3% |
| 2020 | 1,749 | 7,4% |
EBIDTA, billion euros
2016
1,104
2017
1,320
2018
1,413
2019
1,892
2020
1,749
EBIDTA margin
2016
5,5%
2017
5,8%
2018
5,9%
2019
7,3%
2020
7,4%
Profit and free cash flow, million euros
| Operating profit | Net profit | free cash flow | |
|---|---|---|---|
| 2016 | 361 | 320,48 | 901 |
| 2017 | 452 | 420,74 | 1033 |
| 2018 | 521 | 543,00 | 1161 |
| 2019 | 699 | –206,25 | 528 |
| 2020 | 477 | 427,24 | 310 |
Operating profit
2016
361
2017
452
2018
521
2019
699
2020
477
Net profit
2016
320,48
2017
420,74
2018
543,00
2019
–206,25
2020
427,24
free cash flow
2016
901
2017
1033
2018
1161
2019
528
2020
310
Balance sheet indicators
Hochtief assets declined by 10,64%, up to 16.9 billion euros, - this is due to the sale of a 50% stake in Thiess. The capital of the company decreased by 60,3% - up to EUR 963 million. Decrease driven by buyback program and increase in stake in CIMIC, exchange rate effects and other changes outside the income statement. Assets decreased by 10,64%, capital fell by 60,3%.
Assets and capital of the company, billion euros
| Assets | Capital | |
|---|---|---|
| 2016 | 14,077 | 2,571 |
| 2017 | 13,349 | 2,534 |
| 2018 | 15,645 | 2,411 |
| 2019 | 19,005 | 1,595 |
| 2020 | 16,982 | 0,963 |
Assets
2016
14,077
2017
13,349
2018
15,645
2019
19,005
2020
16,982
Capital
2016
2,571
2017
2,534
2018
2,411
2019
1,595
2020
0,963
Debt load
Hochtief's total debt increased by 1% - up to 5.2 billion euros. In 2020, the company received additional loans in the amount of 2.1 billion euros, and also repaid the issue of corporate bonds for 750 million euros, reduced trade payables and dealt with other liabilities. The company's debt payments will peak in 2024.
The volume of net profit decreased by 40,4% - up to 618 million euros. The proceeds - 1.3 billion euros from the sale of a stake in Thiess - were used to pay off obligations of a BICC subsidiary, investor compensation, increase in share in CIMIC, reduction of factoring and currency effects.
Total debt of the company by years, billion euros
| 2016 | 2,662 |
| 2017 | 2,417 |
| 2018 | 3,170 |
| 2019 | 5,166 |
| 2020 | 5,212 |
2016
2,662
2017
2,417
2018
3,170
2019
5,166
2020
5,212
Net profit, billion euros
| 2016 | 0,703 |
| 2017 | 1,265 |
| 2018 | 1,564 |
| 2019 | 1,529 |
| 2020 | 0,618 |
2016
0,703
2017
1,265
2018
1,564
2019
1,529
2020
0,618
Market
World's largest economies adopt stimulus packages in response to pandemic and accompanying economic crisis.
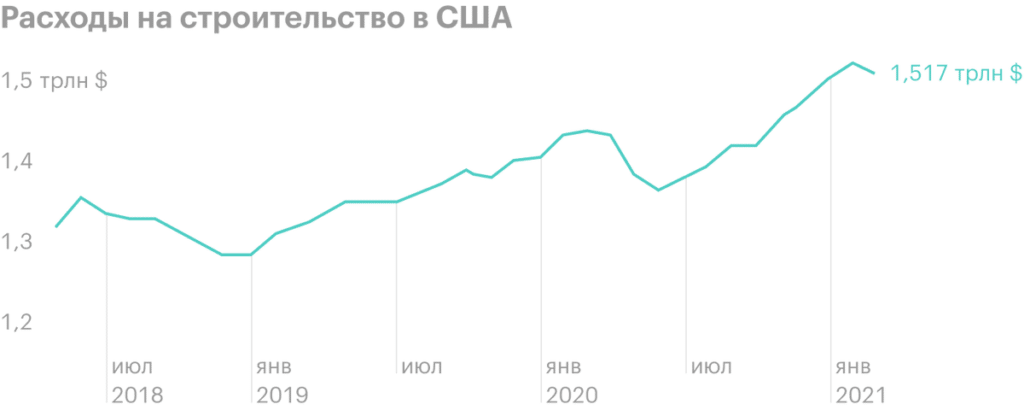
In March, the US considered a plan, involving investments in various infrastructure projects in the amount of $2.3 trillion. And besides this, that in the United States, spending on private construction in December last year has already risen to a maximum value of 1.49 trillion dollars.
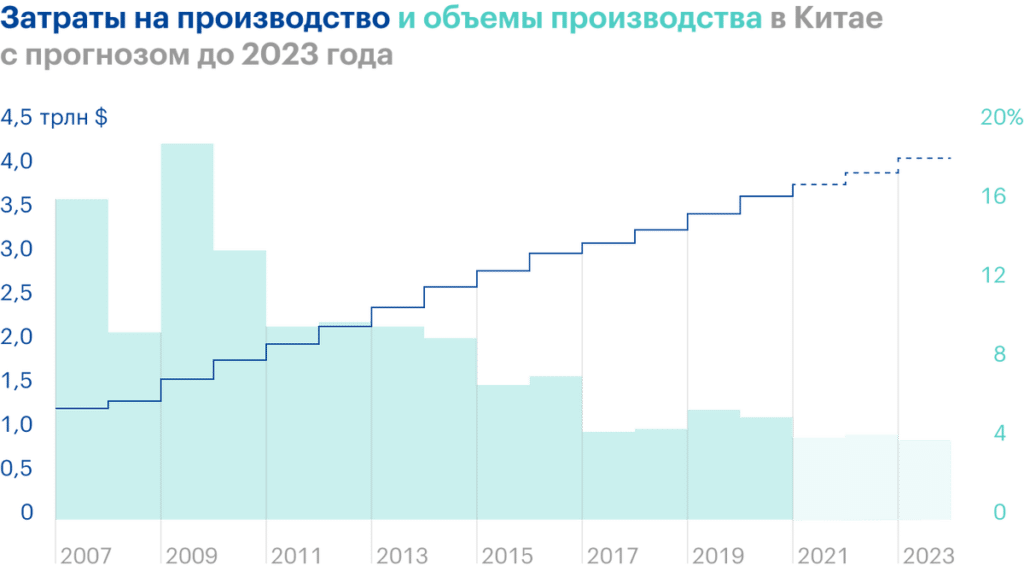
In the Asian region, Hochtief's second largest revenue earner, growth driver is China. In March this year, Beijing announced its five-year development plan for the country - until 2025.. It also aims: doubling GDP by 2035, one of the elements of development will be urbanization. Creation of super-large urban agglomerations should ensure sustainable growth of regions. According to forecasts until 2023, China's construction industry will grow by about 4.5% annually.
The Hochtief team also made optimistic forecasts for the current year.. The company has identified project tenders worth more than 570 billion euros and pledged 180 billion euros for public-private partnership projects, created through government stimulus packages. Therefore, we can expect a stable cash flow from Hochtief in the coming years..


Comparison with analogues
As a comparison, consider the largest European construction companies: Vinci, Skanska, Bouygues. To assess the effectiveness of companies, we have chosen three indicators: revenue growth rate over the past 5 years, ROE, average ROE over 5 years.
We added average ROE values for five years, as Hochtief is now actively pursuing a share buyback program, what distorts ROE.
Revenue growth rates for all companies are low. Based on ROE values and revenue growth rates, can be expected, that in case of favorable market conditions, Hochtief will be more effective than its closest competitors.

Dividends
Hochtief dividends are usually paid at a rate of 65% of nominal earnings as decided by the board of directors. At the end of 2020, the company approved dividends in the amount of 3,93 € per share, which brought shareholders a return of 5%. In addition to dividends, the company returned 168 million euros to shareholders through a share buyback program.
The company's dividend payout ratio is at a comfortable level, leaving resources for development. The average return on stocks over 5 years is 4.66%, and the dividend growth rate is 8,61%.
| Dividend per share | Dividend yield | Payout ratio, percentage of operating profit | |
|---|---|---|---|
| 2016 | 2,60 | 52% | 1,93% |
| 2017 | 3,38 | 52% | 2,50% |
| 2018 | 4.98 | 60% | 6,17% |
| 2019 | 5,80 | 61% | 7,66% |
| 2020 | 3,93 | 51% | 5,04% |
Dividend per share
2016
2,60
2017
3,38
2018
4.98
2019
5,80
2020
3,93
Dividend yield
2016
1,93%
2017
2,50%
2018
6,17%
2019
7,66%
2020
5,04%
Payout ratio, percentage of operating profit
2016
52%
2017
52%
2018
60%
2019
61%
2020
51%
Company multipliers
Most Hochtief group multiples point to share price declines relative to peers. Coefficient P / BV indicates revaluation. In terms of P / E, P / S, EV / EBITDA has upside potential to medium levels - so the company can be considered for a purchase at current levels.
| Company | P / E | P / BV | P / S | EV / EBITDA |
|---|---|---|---|---|
| High Low | 12,56 | 8,10 | 0,24 | 3,25 |
| Vinci | 28,71 | 2,47 | 1,00 | 10,49 |
| Skanska | 9,74 | 2,48 | 0,60 | 7,14 |
| Bouygues | 19,02 | 1,28 | 0,38 | 5,03 |
| Mean | 17,51 | 3,58 | 0,56 | 6,48 |
| Potential to rise or fall | 39% | −56% | 131% | 99% |
High Low
P / E
12,56
P / BV
8,10
P / S
0,24
EV / EBITDA
3,25
Vinci
P / E
28,71
P / BV
2,47
P / S
1,00
EV / EBITDA
10,49
Skanska
P / E
9,74
P / BV
2,48
P / S
0,60
EV / EBITDA
7,14
Bouygues
P / E
19,02
P / BV
1,28
P / S
0,38
EV / EBITDA
5,03
Mean
P / E
17,51
P / BV
3,58
P / S
0,56
EV / EBITDA
6,48
Potential to rise or fall
P / E
39%
P / BV
−56%
P / S
131%
EV / EBITDA
99%
What's the bottom line?
Hochtief Shows Expected Decrease In Key Financials For 2020 Due To The Impact Of The Pandemic. The sale of a 50% stake in Thiess had a significant impact on the company's bottom line. Weak point of the company, and other companies in the construction industry, — low profit margin.
Despite good prospects for the construction market in the US and China, there is no need to expect a significant increase in financial indicators, again due to low marginality. But the company is the most efficient among the closest analogues, it has a discount on most multiples and a good dividend history. Therefore, we can recommend Hochtief shares for purchases at current levels for long-term investments..
Average ROE
| High Low | Vinci | Bouygues | Skanska | |
|---|---|---|---|---|
| 2020 | 46,35 | 6,28 | 7,01 | 29,12 |
| 2019 | −12,98 | 16,27 | 11,68 | 19 |
| 2018 | 43,64 | 15,82 | 13,73 | 15,66 |
| 2017 | 37,70 | 16,91 | 13,28 | 15,75 |
| 2016 | 15,91 | 15,62 | 9,00 | 21,41 |
| 2015 | 10,74 | 13,9 | 5,16 | 18 |
| Mean | 19,002 | 15,704 | 10,57 | 17,964 |
High Low
2020
46,35
2019
−12,98
2018
43,64
2017
37,70
2016
15,91
2015
10,74
Mean
19,002
Vinci
2020
6,28
2019
16,27
2018
15,82
2017
16,91
2016
15,62
2015
13,9
Mean
15,704
Bouygues
2020
7,01
2019
11,68
2018
13,73
2017
13,28
2016
9,00
2015
5,16
Mean
10,57
Skanska
2020
29,12
2019
19
2018
15,66
2017
15,75
2016
21,41
2015
18
Mean
17,964
